

Question: Canvas Question 3 Use the statistical display to answer the question. Marriage Licenses Issued table [ [ March , 0 , 0 , ,
Canvas
Question
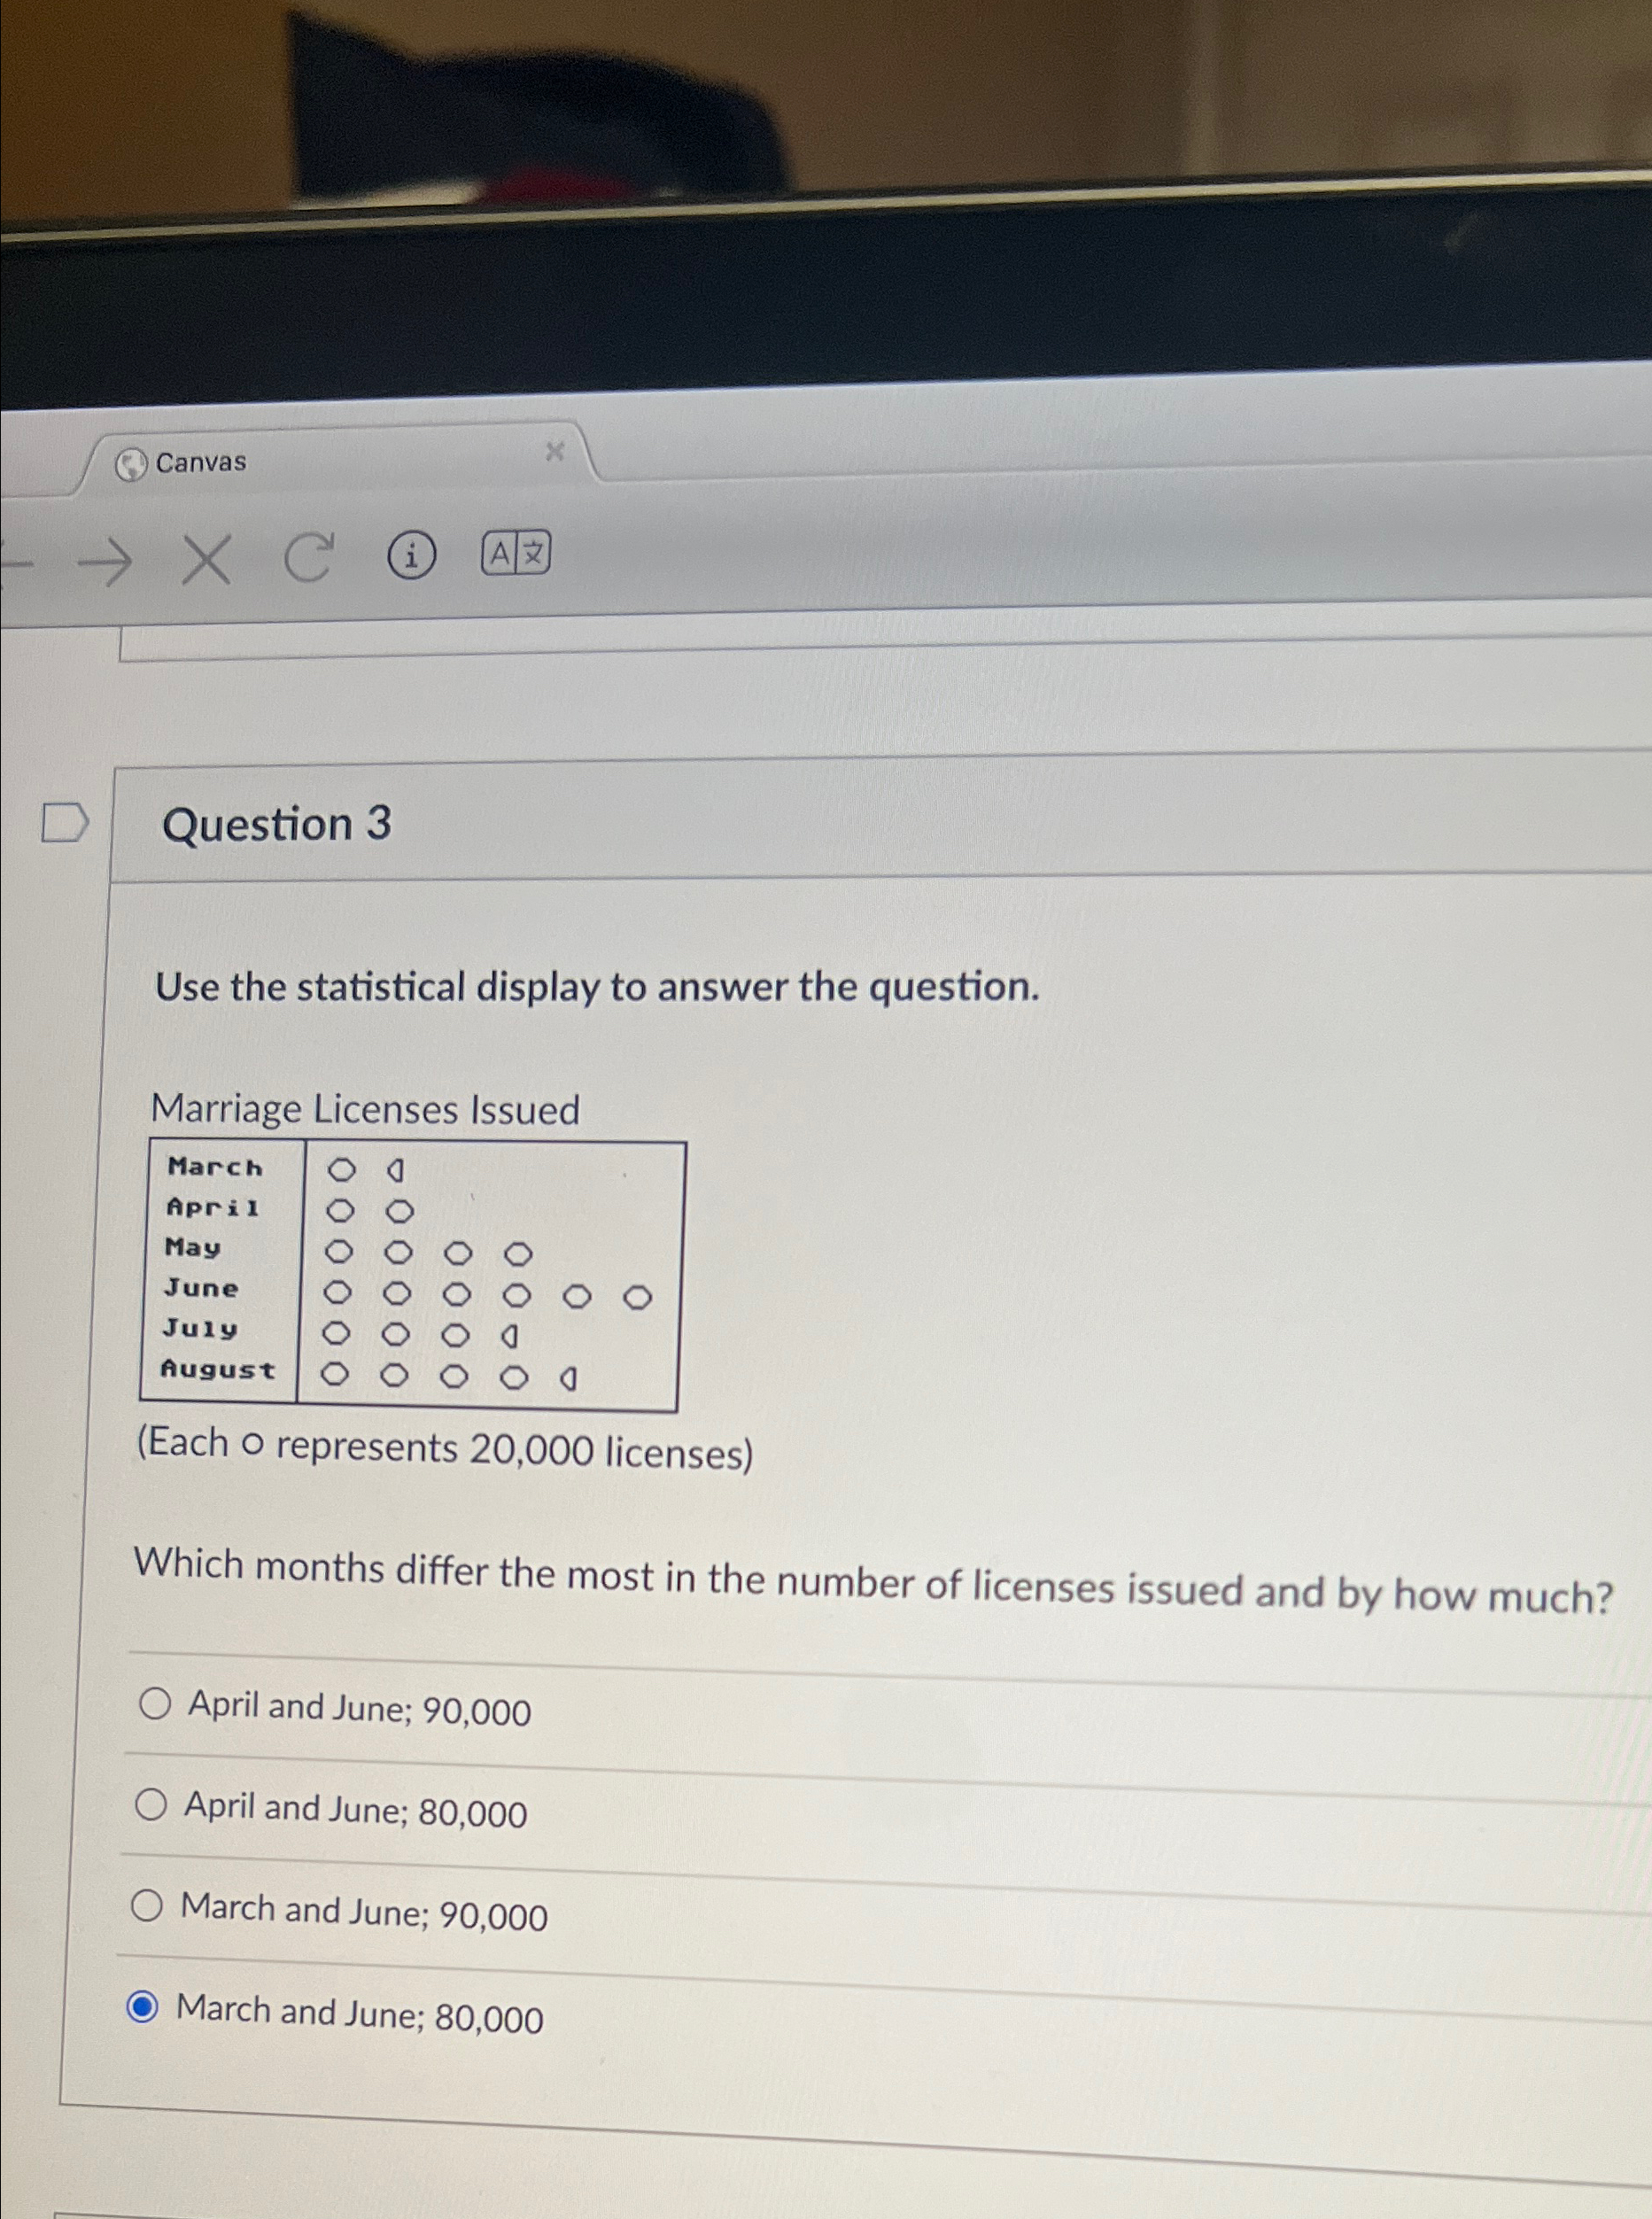
Use the statistical display to answer the question.
Marriage Licenses Issued
tableMarchAprixMayJuneJulyAugust
Each o represents licenses
Which months differ the most in the number of licenses issued and by how much?
April and June;
April and June;
March and June;
March and June;
Step by Step Solution
There are 3 Steps involved in it
1 Expert Approved Answer
Step: 1 Unlock

Question Has Been Solved by an Expert!
Get step-by-step solutions from verified subject matter experts
Step: 2 Unlock
Step: 3 Unlock