

Question: Canvas Student 1 2 : 0 8 PM Sun Oct 2 2 8 6 % IE 5 3 0 3 - EXAM - II -
Canvas Student : PM Sun Oct
IEEXAMIIPRACTICEPROBLEMS
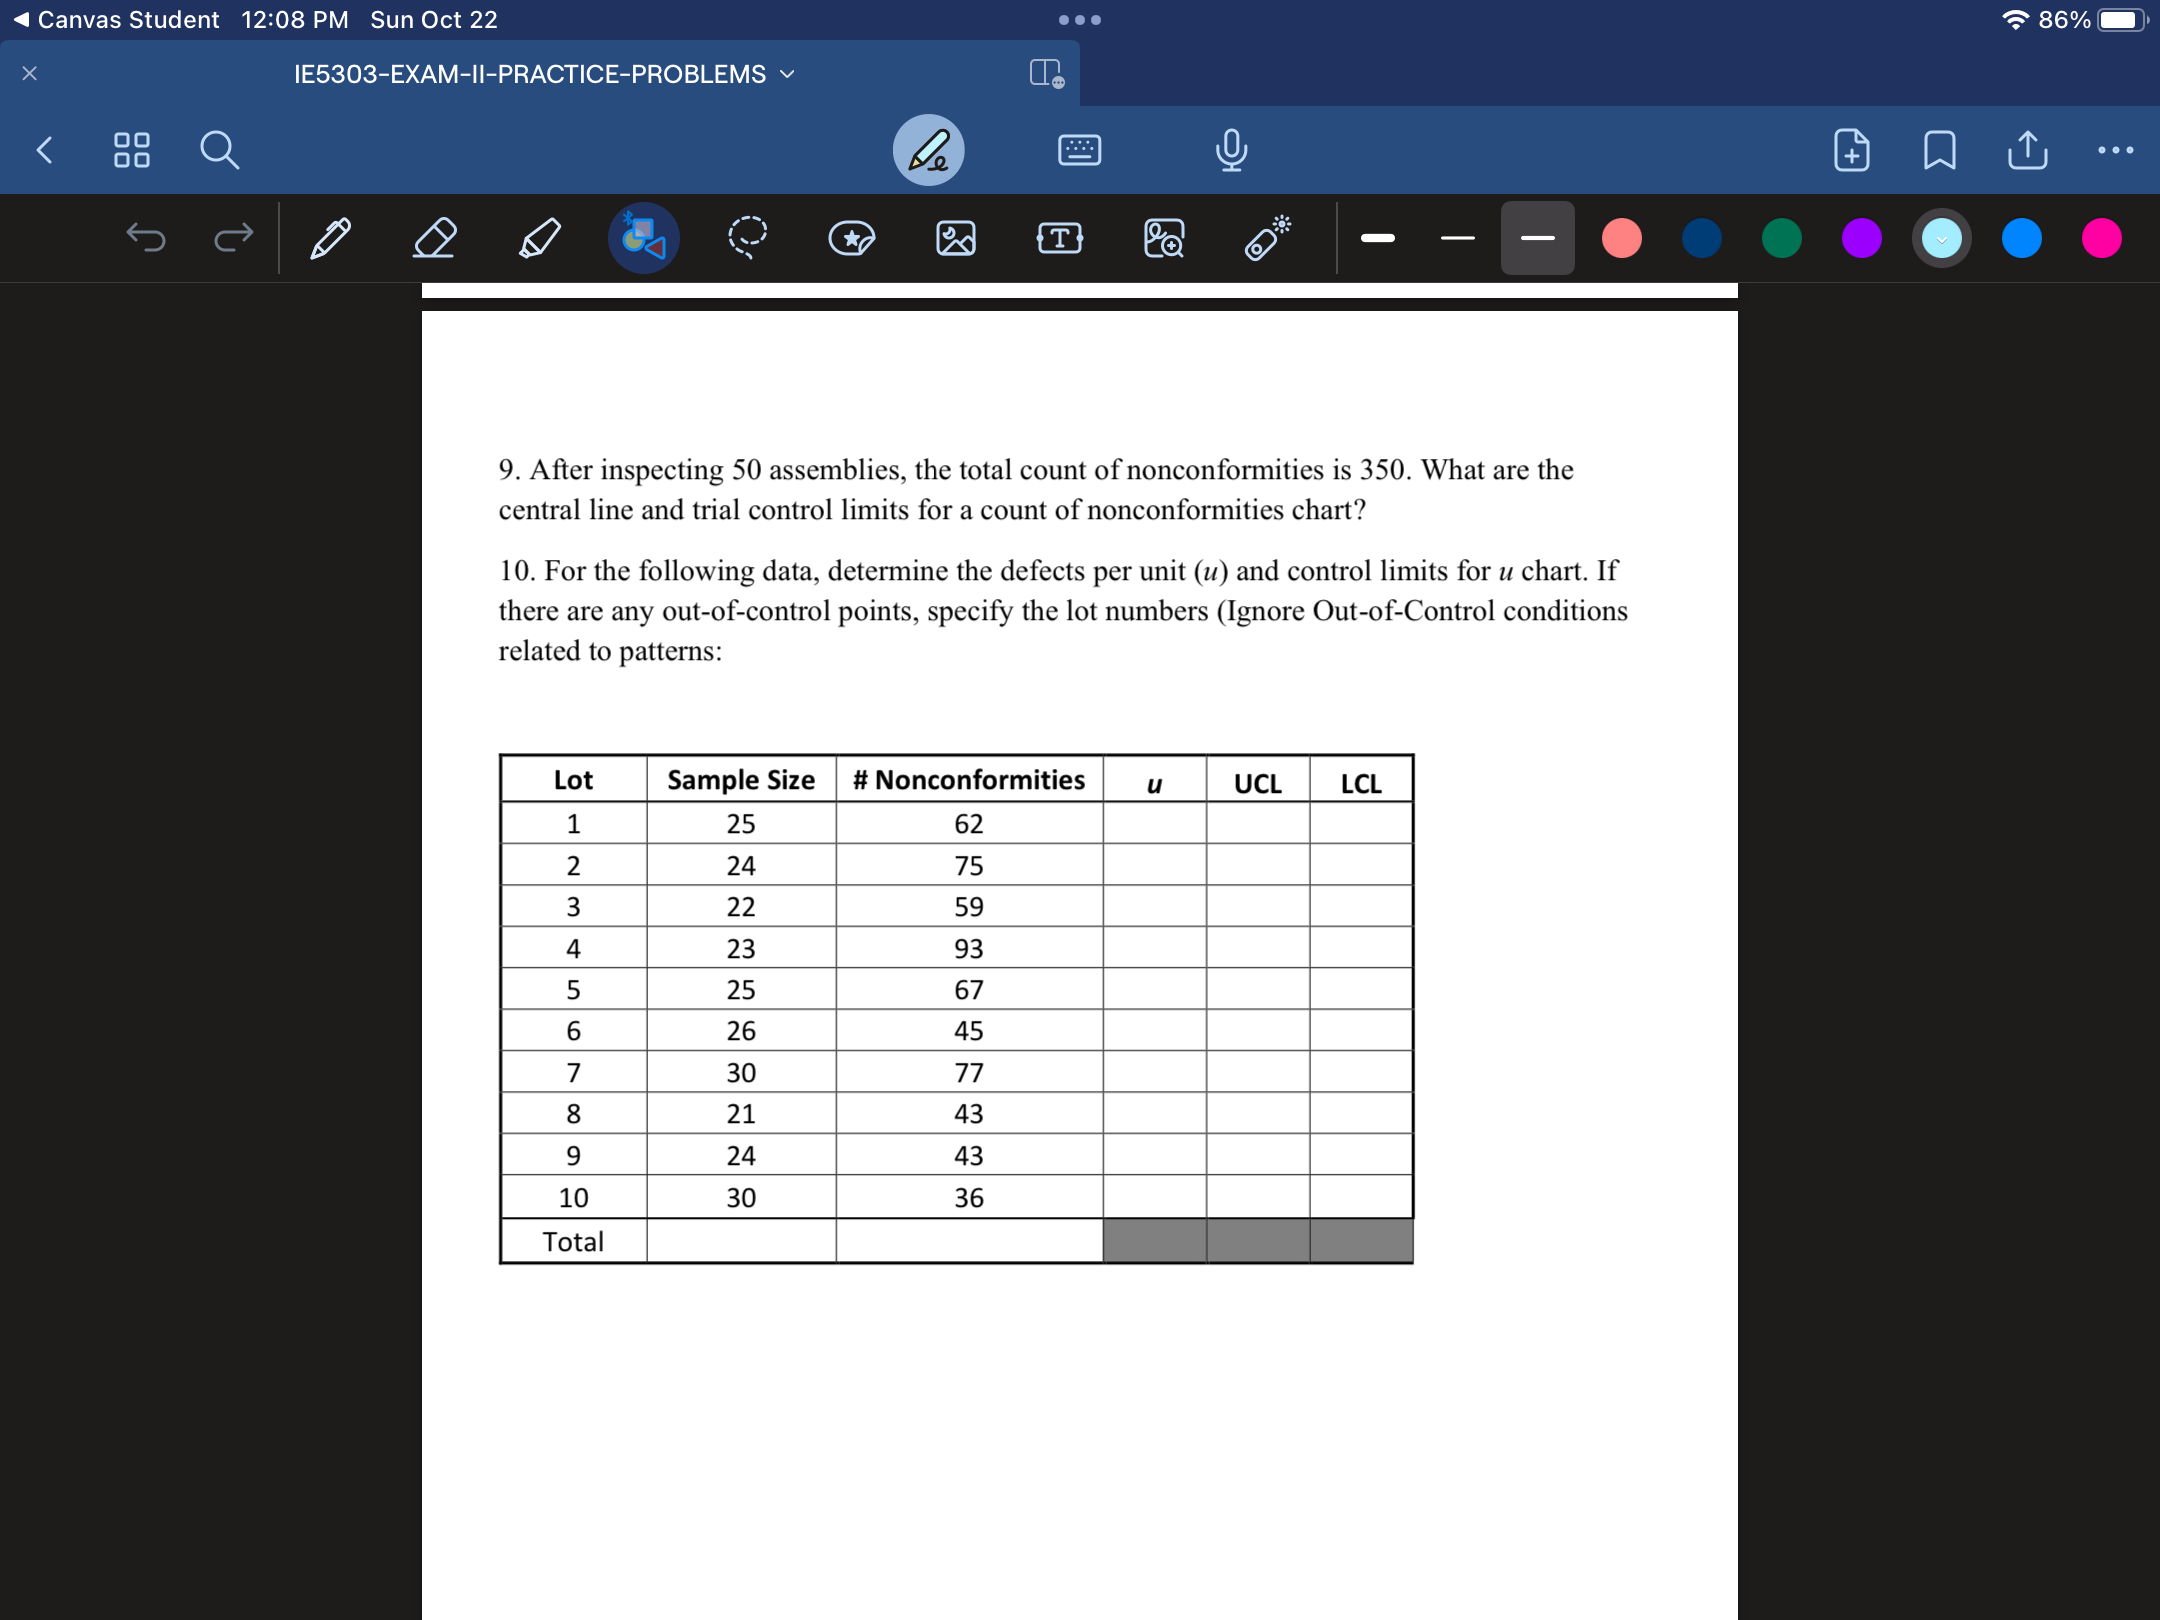
After inspecting assemblies, the total count of nonconformities is What are the central line and trial control limits for a count of nonconformities chart?
For the following data, determine the defects per unit and control limits for chart. If there are any outofcontrol points, specify the lot numbers Ignore OutofControl conditions related to patterns:
tableLotSample Size,# Nonconformities,UCL,LCLTotal
Step by Step Solution
There are 3 Steps involved in it
1 Expert Approved Answer
Step: 1 Unlock

Question Has Been Solved by an Expert!
Get step-by-step solutions from verified subject matter experts
Step: 2 Unlock
Step: 3 Unlock