

Question: Capacity Expansion Model Product A and B require the same amount of capacity to manufacture. That simplifies the analysis of capacity as we can measure
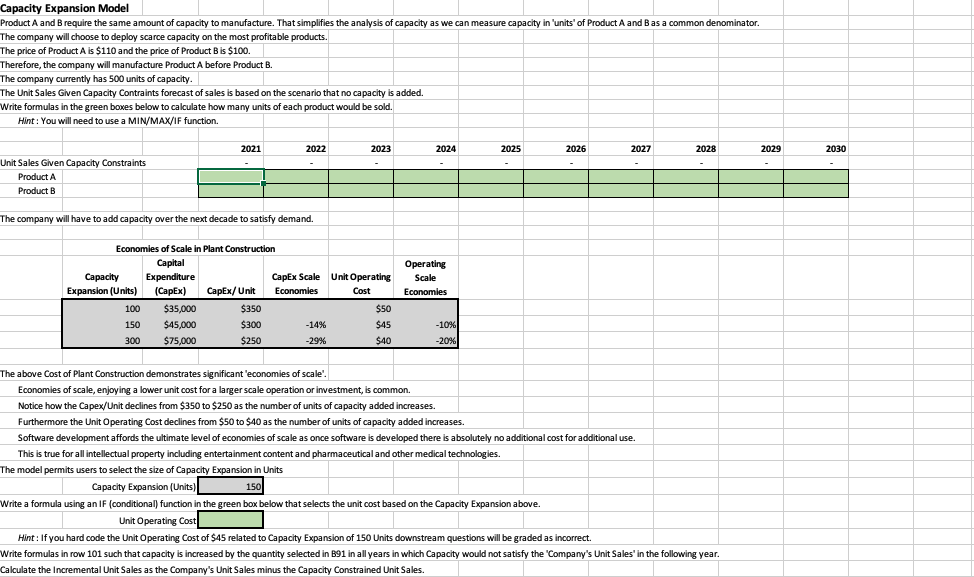
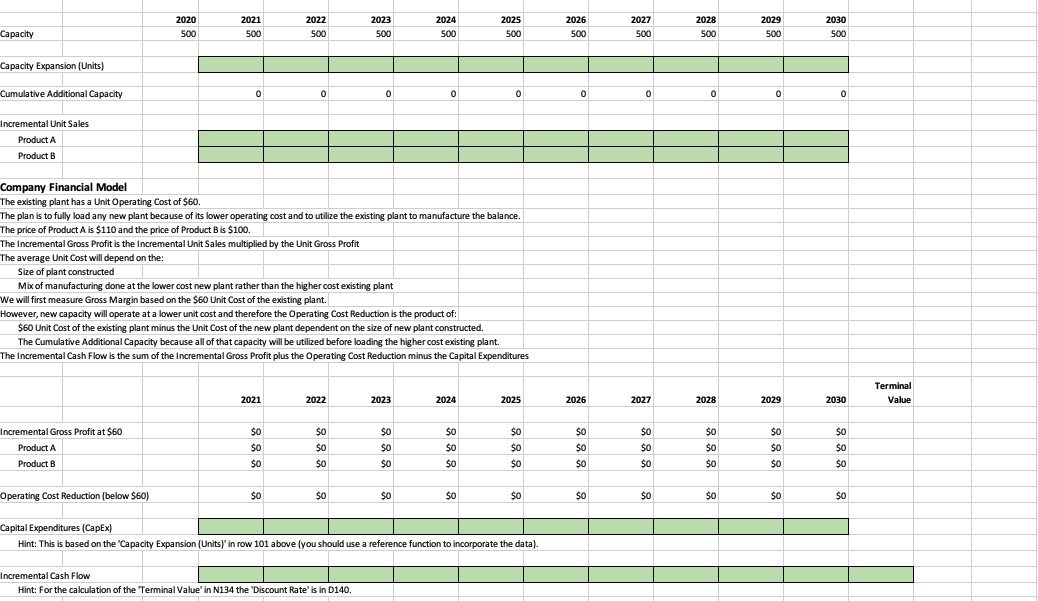
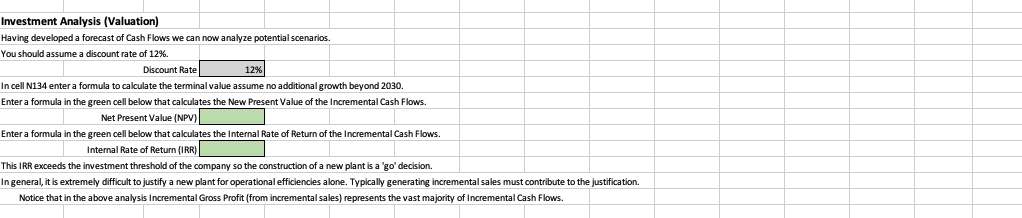
Capacity Expansion Model Product A and B require the same amount of capacity to manufacture. That simplifies the analysis of capacity as we can measure capacity in 'units' of Product A and B as a common denominator. The company will choose to deploy scarce capacity on the most profitable products. The price of Product A is $110 and the price of Product B is $100. Therefore, the company will manufacture Product A before Product B. The company currently has 500 units of capacity. The Unit Sales Given Capacity Contraints forecast of sales is based on the scenario that no capacity is added. Write formulas in the green boxes below to calculate how many units of each product would be sold. Hint: You will need to use a MIN/MAX/IF function. 2021 2022 2023 2024 2025 2026 2027 2028 2029 2030 Unit Sales Given Capacity Constraints Product A Product B The company will have to add capacity over the next decade to satisfy demand. Economies of Scale in Plant Construction Capital Capacity Expenditure CapEx Scale Unit Operating Expansion (Units) (Capex) CapEx/ Unit Economies Cost 100 $35,000 $350 $50 150 $45,000 $300 -14% $45 300 $75,000 $ $250 -29% $40 Operating Scale Economies -10% -20% The above Cost of Plant Construction demonstrates significant 'economies scale Economies of scale, enjoying a lower unit cost for a larger scale operation or investment, is common. Notice how the Capex/Unit declines from $350 to $250 as the number of units of capacity added increases. Furthermore the Unit Operating cost declines from $50 to $40 as the number of units of capacity added increases. Perdangos Software development affords the ultimate level of economies of scale as once software is developed there is absolutely no additional cost for additional use. This is true for all intellectual property including entertainment content and pharmaceutical and other medical technologies. The model permits users to select the size of Capacity Expansion in Units Capacity Expansion (Units) 150 Write a formula using an IF (conditional) function in the green box below that selects the unit cost based on the Capacity Expansion above. Unit Operating Cost Hint: If you hard code the Unit Operating cost of $45 related to Capacity Expansion of 150 Units downstream questions will be graded as incorrect. Write formulas in row 101 such that capacity is increased by the quantity selected in 191 in all years in which Capacity would not satisfy the Company's Unit Sales' in the following year. Calculate the Incremental Unit Sales as the Company's Unit Sales minus the Capacity Constrained Unit Sales. . 2020 500 2021 500 2022 500 2023 500 2024 500 2025 500 2026 500 2027 500 2028 500 2029 500 2030 500 Capacity Capacity Expansion (Units) Cumulative Additional Capacity 0 0 0 0 0 0 0 0 0 0 Incremental Unit Sales Product A Product B Company Financial Model The existing plant has a Unit Operating cost of $60. The plan is to fully load any new plant because of its lower operating cost and to utilize the existing plant to manufacture the balance. The price of Product A is $110 and the price of Product B is $100. The Incremental Gross Profit is the Incremental Unit Sales multiplied by the Unit Gross Profit The average Unit Cost will depend on the: Size of plant constructed Mix of manufacturing done at the lower cost new plant rather than the higher cost existing plant We will first measure Gross Margin based on the $60 Unit Cost of the existing plant. However, new capacity will operate at a lower unit cost and therefore the Operating Cost Reduction is the product of: $60 Unit Cost of the existing plant minus the Unit Cost of the new plant dependent on the size of new plant constructed. The Cumulative Additional Capacity because all of that capacity will be utilized before loading the higher cost existing plant. The Incremental Cash Flow is the sum of the Incremental Gross Profit plus the Operating Cost Reduction minus the Capital Expenditures Terminal Value 2021 2022 2023 2024 2025 2026 2027 2028 2029 2030 Incremental Gross Profit at $60 Product A Product B $0 $0 $0 $0 $0 $0 $0 $0 $0 $0 SO $0 $0 $0 $0 $0 $0 $0 $0 $0 $0 $0 $0 $0 $0 $0 $0 $0 $0 $0 Operating Cost Reduction (below $60) ) $0 $0 SO SO SO $0 $0 $0 $O SO Capital Expenditures (CapEx) Hint: This is based on the 'Capacity Expansion (Units)' in row 101 above (you should use a reference function to incorporate the data) Incremental Cash Flow Hint: For the calculation of the Terminal Value' in N134 the "Discount Rate' is in D140. Investment Analysis (Valuation) Having developed a forecast of Cash Flows we can now analyze potential scenarios. You should assume a discount rate of 12% Discount Rate 12% dan In cell N134 enter a formula to calculate the terminal value assume no additional growth beyond 2030. Enter a formula in the green cell below that calculates the New Present Value of the Incremental Cash Flows. Net Present Value (NPV) Enter a formula in the green cell below that calculates the Internal Rate of Return of the Incremental Cash Flows. Internal Rate of Return (IRR) This IRR exceeds the investment threshold of the company so the construction of a new plant is a 'go' decision. In general, it is extremely difficult to justify a new plant for operational efficiencies alone. Typically generating incremental sales must contribute to the justification. Notice that in the above analysis Incremental Gross Profit (from incremental sales represents the vast majority of Incremental Cash Flows. Capacity Expansion Model Product A and B require the same amount of capacity to manufacture. That simplifies the analysis of capacity as we can measure capacity in 'units' of Product A and B as a common denominator. The company will choose to deploy scarce capacity on the most profitable products. The price of Product A is $110 and the price of Product B is $100. Therefore, the company will manufacture Product A before Product B. The company currently has 500 units of capacity. The Unit Sales Given Capacity Contraints forecast of sales is based on the scenario that no capacity is added. Write formulas in the green boxes below to calculate how many units of each product would be sold. Hint: You will need to use a MIN/MAX/IF function. 2021 2022 2023 2024 2025 2026 2027 2028 2029 2030 Unit Sales Given Capacity Constraints Product A Product B The company will have to add capacity over the next decade to satisfy demand. Economies of Scale in Plant Construction Capital Capacity Expenditure CapEx Scale Unit Operating Expansion (Units) (Capex) CapEx/ Unit Economies Cost 100 $35,000 $350 $50 150 $45,000 $300 -14% $45 300 $75,000 $ $250 -29% $40 Operating Scale Economies -10% -20% The above Cost of Plant Construction demonstrates significant 'economies scale Economies of scale, enjoying a lower unit cost for a larger scale operation or investment, is common. Notice how the Capex/Unit declines from $350 to $250 as the number of units of capacity added increases. Furthermore the Unit Operating cost declines from $50 to $40 as the number of units of capacity added increases. Perdangos Software development affords the ultimate level of economies of scale as once software is developed there is absolutely no additional cost for additional use. This is true for all intellectual property including entertainment content and pharmaceutical and other medical technologies. The model permits users to select the size of Capacity Expansion in Units Capacity Expansion (Units) 150 Write a formula using an IF (conditional) function in the green box below that selects the unit cost based on the Capacity Expansion above. Unit Operating Cost Hint: If you hard code the Unit Operating cost of $45 related to Capacity Expansion of 150 Units downstream questions will be graded as incorrect. Write formulas in row 101 such that capacity is increased by the quantity selected in 191 in all years in which Capacity would not satisfy the Company's Unit Sales' in the following year. Calculate the Incremental Unit Sales as the Company's Unit Sales minus the Capacity Constrained Unit Sales. . 2020 500 2021 500 2022 500 2023 500 2024 500 2025 500 2026 500 2027 500 2028 500 2029 500 2030 500 Capacity Capacity Expansion (Units) Cumulative Additional Capacity 0 0 0 0 0 0 0 0 0 0 Incremental Unit Sales Product A Product B Company Financial Model The existing plant has a Unit Operating cost of $60. The plan is to fully load any new plant because of its lower operating cost and to utilize the existing plant to manufacture the balance. The price of Product A is $110 and the price of Product B is $100. The Incremental Gross Profit is the Incremental Unit Sales multiplied by the Unit Gross Profit The average Unit Cost will depend on the: Size of plant constructed Mix of manufacturing done at the lower cost new plant rather than the higher cost existing plant We will first measure Gross Margin based on the $60 Unit Cost of the existing plant. However, new capacity will operate at a lower unit cost and therefore the Operating Cost Reduction is the product of: $60 Unit Cost of the existing plant minus the Unit Cost of the new plant dependent on the size of new plant constructed. The Cumulative Additional Capacity because all of that capacity will be utilized before loading the higher cost existing plant. The Incremental Cash Flow is the sum of the Incremental Gross Profit plus the Operating Cost Reduction minus the Capital Expenditures Terminal Value 2021 2022 2023 2024 2025 2026 2027 2028 2029 2030 Incremental Gross Profit at $60 Product A Product B $0 $0 $0 $0 $0 $0 $0 $0 $0 $0 SO $0 $0 $0 $0 $0 $0 $0 $0 $0 $0 $0 $0 $0 $0 $0 $0 $0 $0 $0 Operating Cost Reduction (below $60) ) $0 $0 SO SO SO $0 $0 $0 $O SO Capital Expenditures (CapEx) Hint: This is based on the 'Capacity Expansion (Units)' in row 101 above (you should use a reference function to incorporate the data) Incremental Cash Flow Hint: For the calculation of the Terminal Value' in N134 the "Discount Rate' is in D140. Investment Analysis (Valuation) Having developed a forecast of Cash Flows we can now analyze potential scenarios. You should assume a discount rate of 12% Discount Rate 12% dan In cell N134 enter a formula to calculate the terminal value assume no additional growth beyond 2030. Enter a formula in the green cell below that calculates the New Present Value of the Incremental Cash Flows. Net Present Value (NPV) Enter a formula in the green cell below that calculates the Internal Rate of Return of the Incremental Cash Flows. Internal Rate of Return (IRR) This IRR exceeds the investment threshold of the company so the construction of a new plant is a 'go' decision. In general, it is extremely difficult to justify a new plant for operational efficiencies alone. Typically generating incremental sales must contribute to the justification. Notice that in the above analysis Incremental Gross Profit (from incremental sales represents the vast majority of Incremental Cash Flows
Step by Step Solution
There are 3 Steps involved in it

Get step-by-step solutions from verified subject matter experts