

Question: Captured with Xnip urrent Attempt in Progress Mop and Broom Manufacturing has tracked the number of units sold of their most popular mop over the
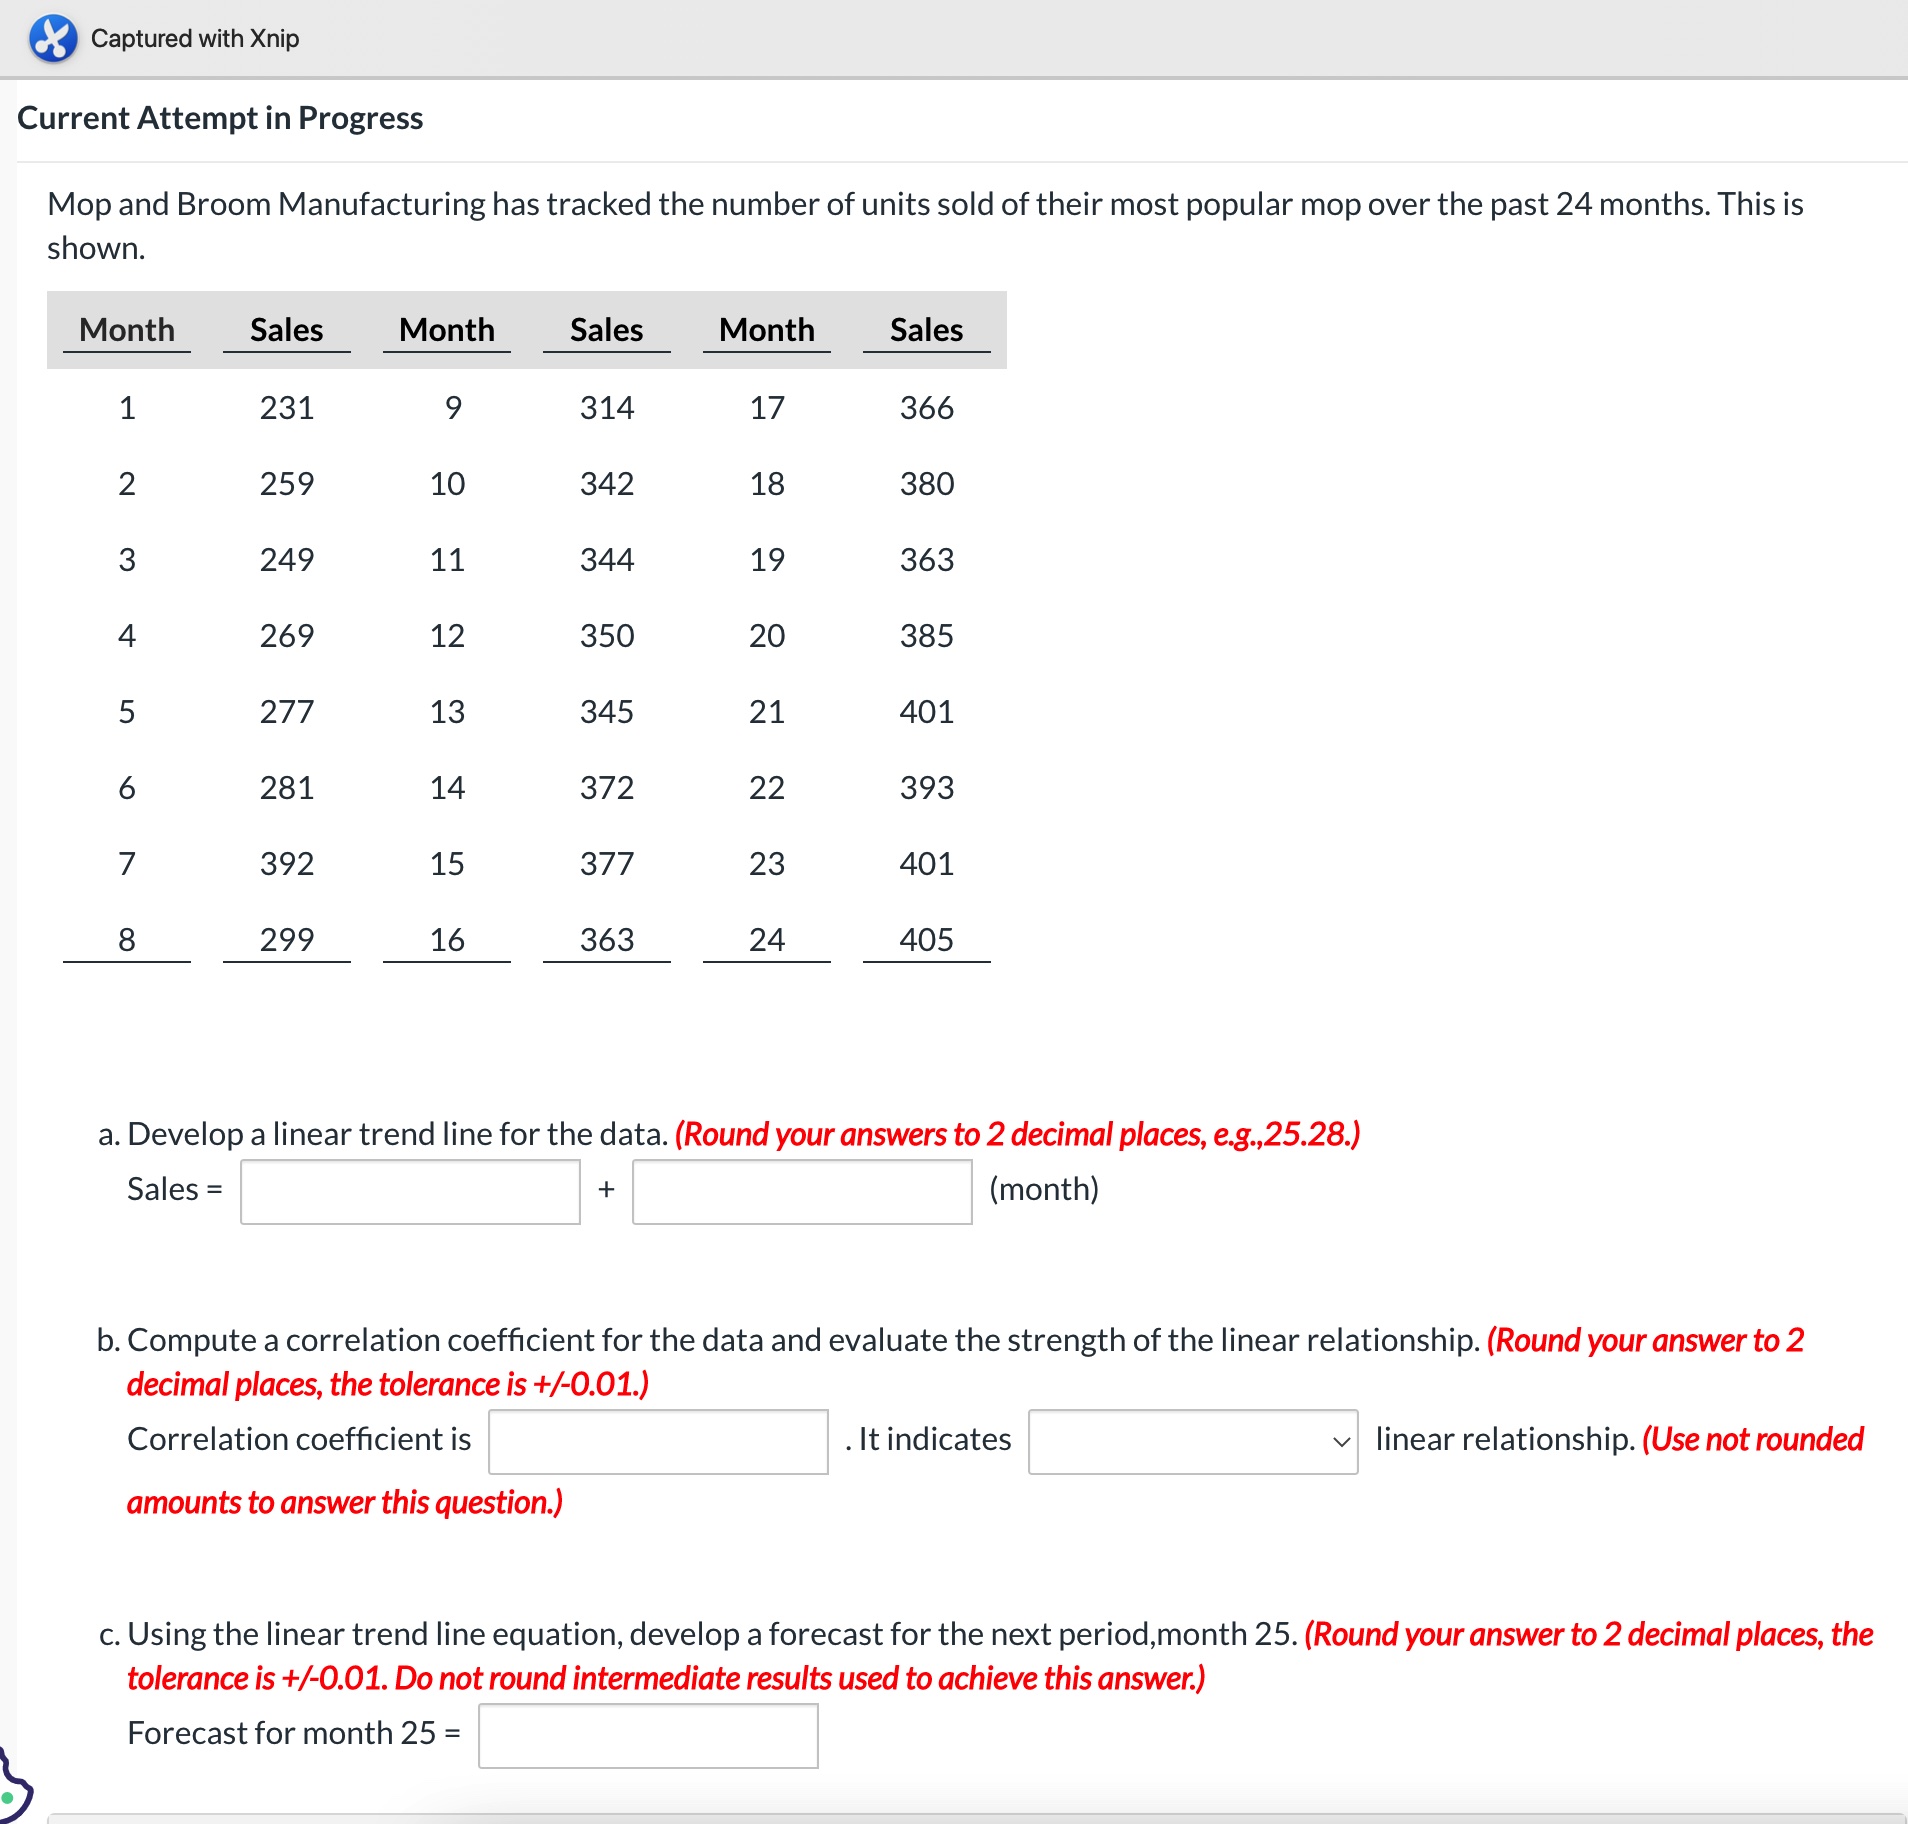
Captured with Xnip urrent Attempt in Progress Mop and Broom Manufacturing has tracked the number of units sold of their most popular mop over the past 24 months. This is shown. a. Develop a linear trend line for the data. (Round your answers to 2 decimal places, e.g.,25.28.) Sales = (month) b. Compute a correlation coefficient for the data and evaluate the strength of the linear relationship. (Round your answer to 2 decimal places, the tolerance is +/0.01.) Correlation coefficient is . It indicates linear relationship. (Use not rounded amounts to answer this question.) c. Using the linear trend line equation, develop a forecast for the next period,month 25 . (Round your answer to 2 decimal places, the tolerance is +/0.01. Do not round intermediate results used to achieve this answer.) Forecast for month 25=
Step by Step Solution
There are 3 Steps involved in it

Get step-by-step solutions from verified subject matter experts