

Question: carefully Panel (a) Panel (b) Quantity Quantity Panel (c) Panel (d) Quantity Quantity Let us assume that the graphs in this figure represent the demand
carefully
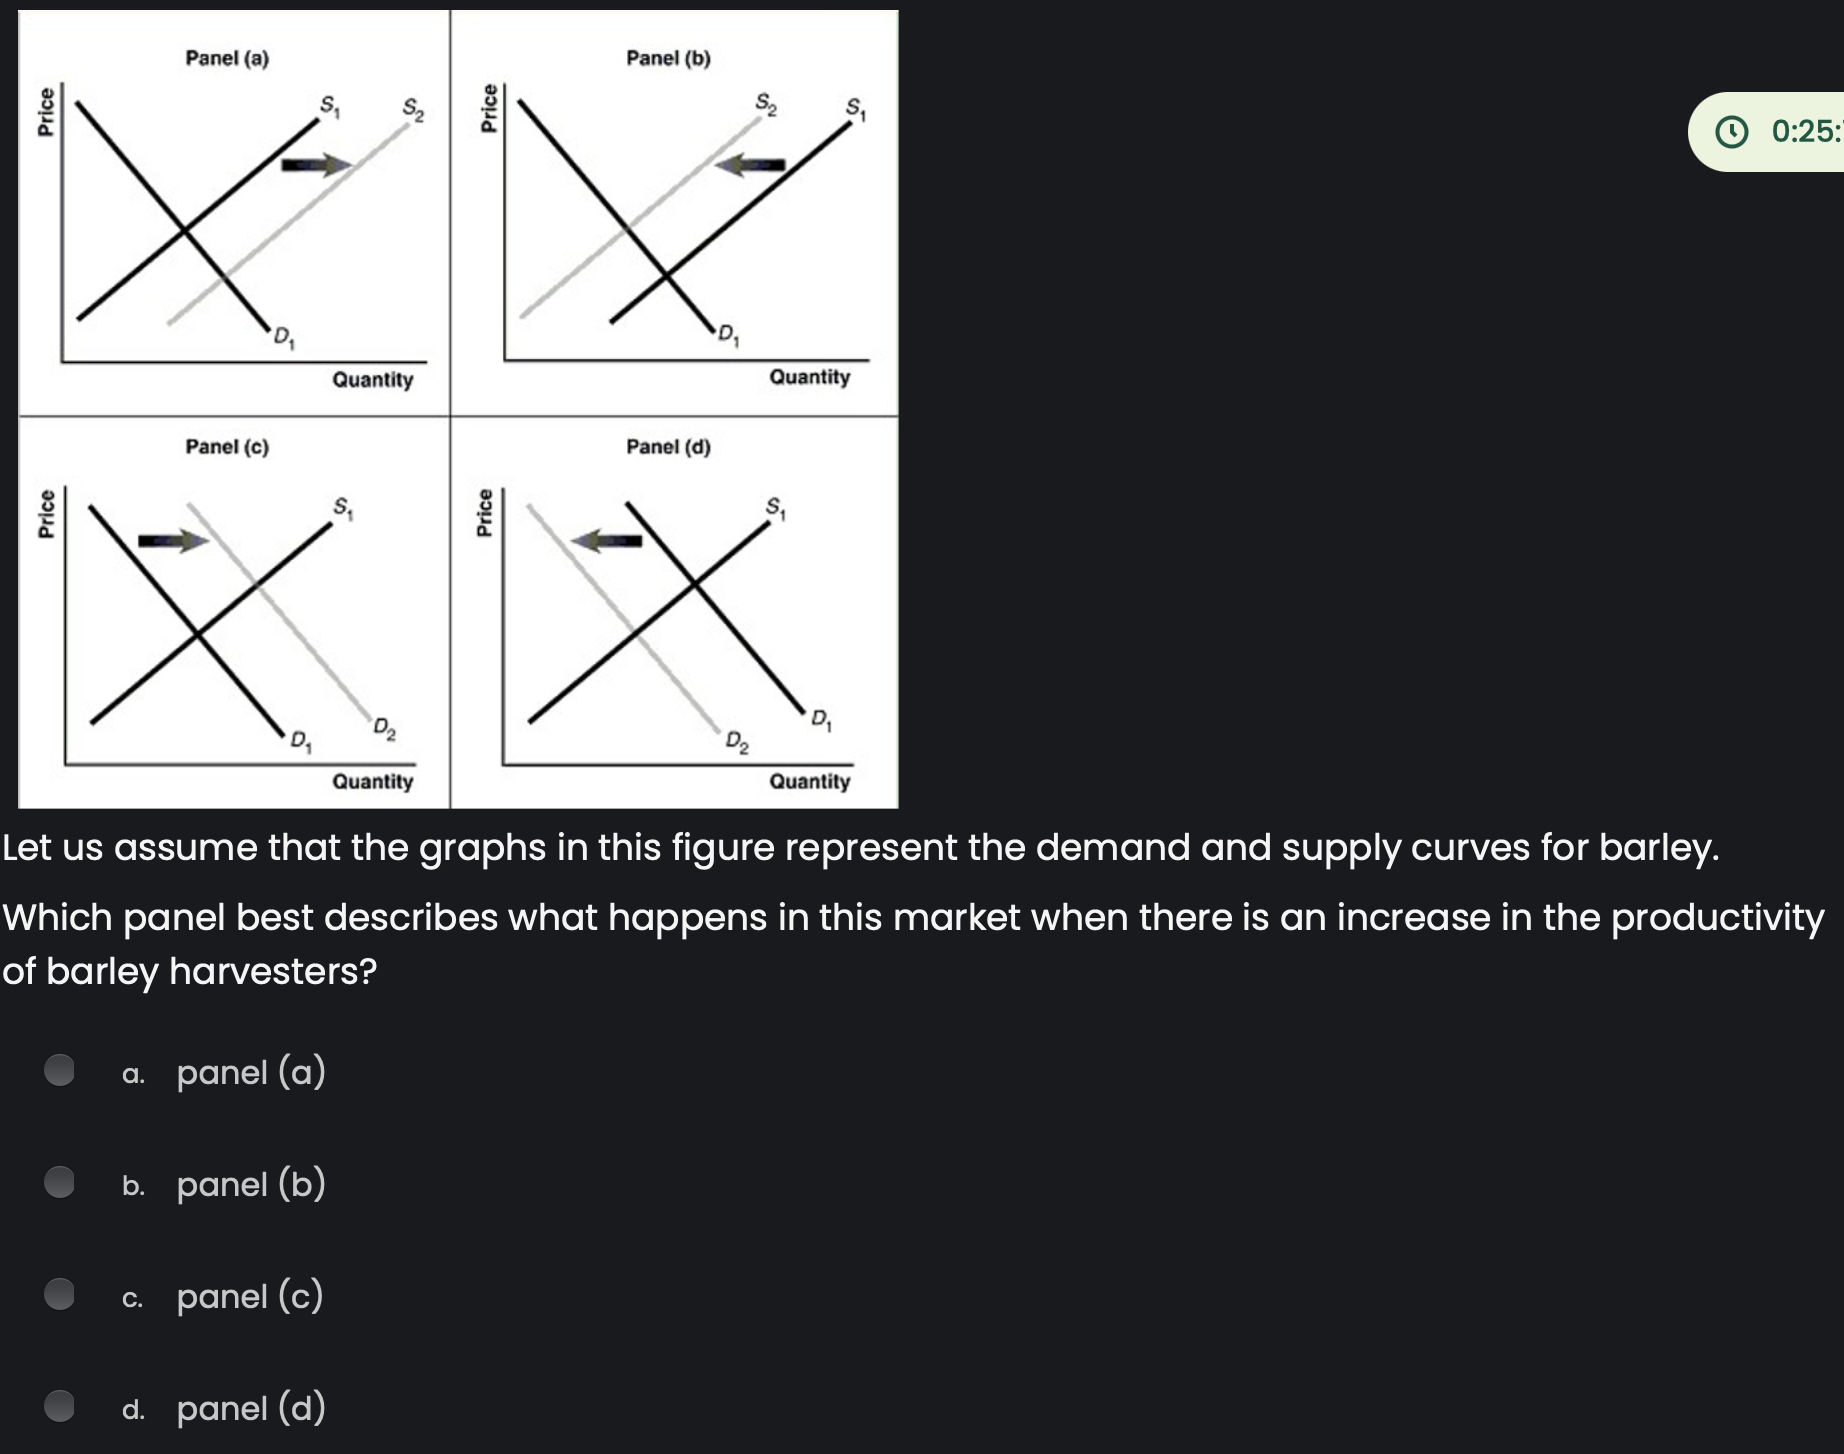 Panel (a) Panel (b) Quantity Quantity Panel (c) Panel (d) Quantity Quantity Let us assume that the graphs in this figure represent the demand and supply curves for barley. Which panel best describes what happens in this market when there is an increase in the productivity of barley harvesters? panel (a) panel (b) panel (c) panel (d)
Step by Step Solution
There are 3 Steps involved in it
1 Expert Approved Answer
Step: 1 Unlock

Question Has Been Solved by an Expert!
Get step-by-step solutions from verified subject matter experts
Step: 2 Unlock
Step: 3 Unlock