

Question: Carl selects one random sample from a population and calculates three confidence intervals for p. His intervals are below. A B C p*+ 0.080 *p
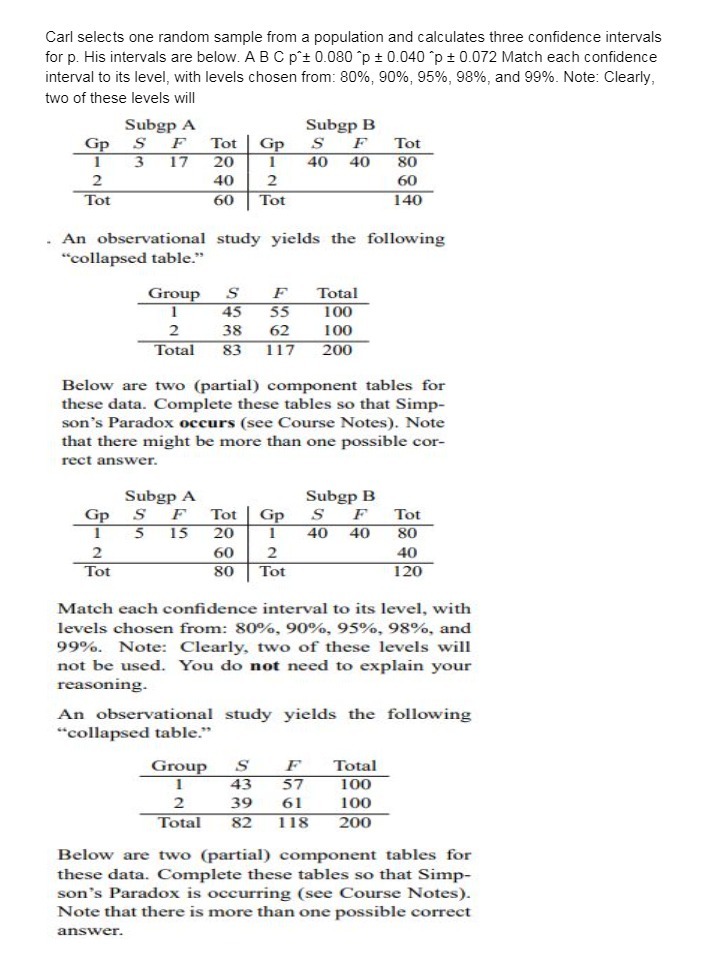
Carl selects one random sample from a population and calculates three confidence intervals for p. His intervals are below. A B C p*+ 0.080 *p + 0.040 "p + 0.072 Match each confidence interval to its level, with levels chosen from: 80%, 90%, 95%, 98%, and 99%. Note: Clearly, two of these levels will Subgp A Subgp B Gp S F Tot Gp S F Tot 17 20 40 40 80 40 2 60 Tot 60 Tot 140 An observational study yields the following "collapsed table." Group S F Total 45 55 100 2 38 62 100 Total 83 117 200 Below are two (partial) component tables for these data. Complete these tables so that Simp- son's Paradox occurs (see Course Notes). Note that there might be more than one possible cor- rect answer. Subgp A Subgp B Gp S F Tot Gp S F Tot 5 15 20 40 40 80 60 2 40 Tot 80 Tot 120 Match each confidence interval to its level, with levels chosen from: 80%, 90%, 95%, 98%, and 99%. Note: Clearly, two of these levels will not be used. You do not need to explain your reasoning. An observational study yields the following "collapsed table." Group S F Total 43 57 100 2 39 61 100 Total 82 118 200 Below are two (partial) component tables for these data. Complete these tables so that Simp- son's Paradox is occurring (see Course Notes). Note that there is more than one possible correct
Step by Step Solution
There are 3 Steps involved in it

Get step-by-step solutions from verified subject matter experts