

Caroline has a $10 dessert budget that she uses to buy pie and cake. Assume the...
Fantastic news! We've Found the answer you've been seeking!
Question:
Transcribed Image Text:
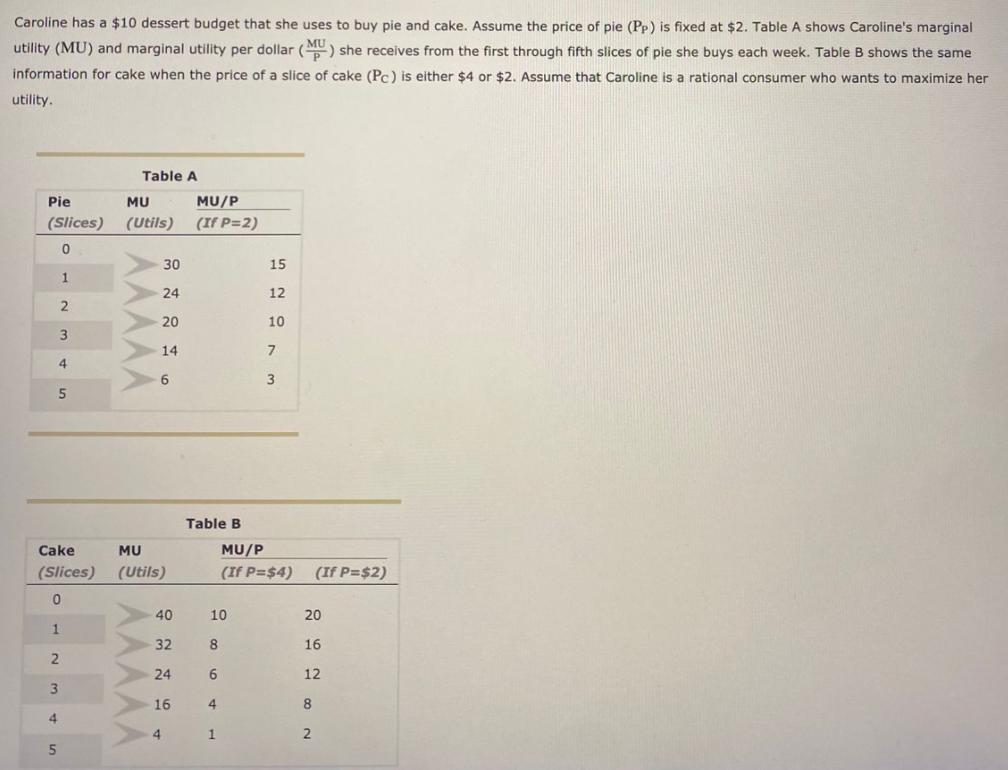
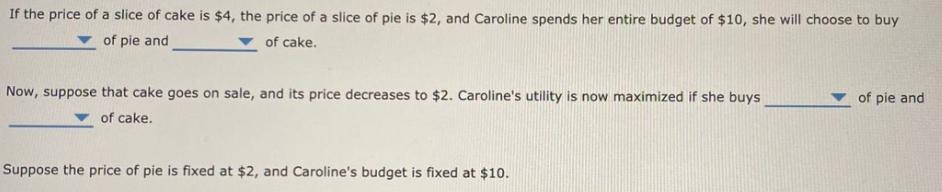
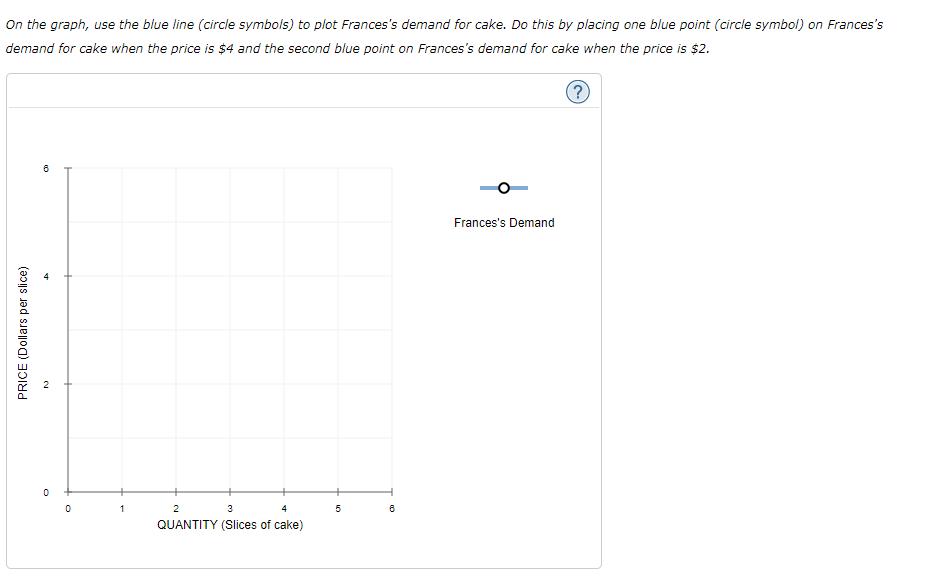
Caroline has a $10 dessert budget that she uses to buy pie and cake. Assume the price of pie (Pp) is fixed at $2. Table A shows Caroline's marginal utility (MU) and marginal utility per dollar () she receives from the first through fifth slices of pie she buys each week. Table B shows the same information for cake when the price of a slice of cake (Pc) is either $4 or $2. Assume that Caroline is a rational consumer who wants to maximize her utility. Table A Pie MU MU/P (Slices) (Utils) (If P=2) 30 15 1. 24 12 20 10 14 7 4. 6 5 Table B Cake MU MU/P (Slices) (Utils) (If P=$4) (If P=$2) 40 10 20 32 8 16 24 12 16 4. 4 4. 1 2 5 AAAAA AAAAA If the price of a slice of cake is $4, the price of a slice of pie is $2, and Caroline spends her entire budget of $10, she will choose to buy of pie and of cake. Now, suppose that cake goes on sale, and its price decreases to $2. Caroline's utility is now maximized if she buys of pie and of cake. Suppose the price of pie is fixed at $2, and Caroline's budget is fixed at $10. On the graph, use the blue line (circle symbols) to plot Frances's demand for cake. Do this by placing one blue point (circle symbol) on Frances's demand for cake when the price is $4 and the second blue point on Frances's demand for cake when the price is $2. Frances's Demand 1 2 3 4 5 QUANTITY (Slices of cake) PRICE (Dollars per slice) Caroline has a $10 dessert budget that she uses to buy pie and cake. Assume the price of pie (Pp) is fixed at $2. Table A shows Caroline's marginal utility (MU) and marginal utility per dollar () she receives from the first through fifth slices of pie she buys each week. Table B shows the same information for cake when the price of a slice of cake (Pc) is either $4 or $2. Assume that Caroline is a rational consumer who wants to maximize her utility. Table A Pie MU MU/P (Slices) (Utils) (If P=2) 30 15 1. 24 12 20 10 14 7 4. 6 5 Table B Cake MU MU/P (Slices) (Utils) (If P=$4) (If P=$2) 40 10 20 32 8 16 24 12 16 4. 4 4. 1 2 5 AAAAA AAAAA If the price of a slice of cake is $4, the price of a slice of pie is $2, and Caroline spends her entire budget of $10, she will choose to buy of pie and of cake. Now, suppose that cake goes on sale, and its price decreases to $2. Caroline's utility is now maximized if she buys of pie and of cake. Suppose the price of pie is fixed at $2, and Caroline's budget is fixed at $10. On the graph, use the blue line (circle symbols) to plot Frances's demand for cake. Do this by placing one blue point (circle symbol) on Frances's demand for cake when the price is $4 and the second blue point on Frances's demand for cake when the price is $2. Frances's Demand 1 2 3 4 5 QUANTITY (Slices of cake) PRICE (Dollars per slice) Caroline has a $10 dessert budget that she uses to buy pie and cake. Assume the price of pie (Pp) is fixed at $2. Table A shows Caroline's marginal utility (MU) and marginal utility per dollar () she receives from the first through fifth slices of pie she buys each week. Table B shows the same information for cake when the price of a slice of cake (Pc) is either $4 or $2. Assume that Caroline is a rational consumer who wants to maximize her utility. Table A Pie MU MU/P (Slices) (Utils) (If P=2) 30 15 1. 24 12 20 10 14 7 4. 6 5 Table B Cake MU MU/P (Slices) (Utils) (If P=$4) (If P=$2) 40 10 20 32 8 16 24 12 16 4. 4 4. 1 2 5 AAAAA AAAAA If the price of a slice of cake is $4, the price of a slice of pie is $2, and Caroline spends her entire budget of $10, she will choose to buy of pie and of cake. Now, suppose that cake goes on sale, and its price decreases to $2. Caroline's utility is now maximized if she buys of pie and of cake. Suppose the price of pie is fixed at $2, and Caroline's budget is fixed at $10. On the graph, use the blue line (circle symbols) to plot Frances's demand for cake. Do this by placing one blue point (circle symbol) on Frances's demand for cake when the price is $4 and the second blue point on Frances's demand for cake when the price is $2. Frances's Demand 1 2 3 4 5 QUANTITY (Slices of cake) PRICE (Dollars per slice) Caroline has a $10 dessert budget that she uses to buy pie and cake. Assume the price of pie (Pp) is fixed at $2. Table A shows Caroline's marginal utility (MU) and marginal utility per dollar () she receives from the first through fifth slices of pie she buys each week. Table B shows the same information for cake when the price of a slice of cake (Pc) is either $4 or $2. Assume that Caroline is a rational consumer who wants to maximize her utility. Table A Pie MU MU/P (Slices) (Utils) (If P=2) 30 15 1. 24 12 20 10 14 7 4. 6 5 Table B Cake MU MU/P (Slices) (Utils) (If P=$4) (If P=$2) 40 10 20 32 8 16 24 12 16 4. 4 4. 1 2 5 AAAAA AAAAA If the price of a slice of cake is $4, the price of a slice of pie is $2, and Caroline spends her entire budget of $10, she will choose to buy of pie and of cake. Now, suppose that cake goes on sale, and its price decreases to $2. Caroline's utility is now maximized if she buys of pie and of cake. Suppose the price of pie is fixed at $2, and Caroline's budget is fixed at $10. On the graph, use the blue line (circle symbols) to plot Frances's demand for cake. Do this by placing one blue point (circle symbol) on Frances's demand for cake when the price is $4 and the second blue point on Frances's demand for cake when the price is $2. Frances's Demand 1 2 3 4 5 QUANTITY (Slices of cake) PRICE (Dollars per slice) Caroline has a $10 dessert budget that she uses to buy pie and cake. Assume the price of pie (Pp) is fixed at $2. Table A shows Caroline's marginal utility (MU) and marginal utility per dollar () she receives from the first through fifth slices of pie she buys each week. Table B shows the same information for cake when the price of a slice of cake (Pc) is either $4 or $2. Assume that Caroline is a rational consumer who wants to maximize her utility. Table A Pie MU MU/P (Slices) (Utils) (If P=2) 30 15 1. 24 12 20 10 14 7 4. 6 5 Table B Cake MU MU/P (Slices) (Utils) (If P=$4) (If P=$2) 40 10 20 32 8 16 24 12 16 4. 4 4. 1 2 5 AAAAA AAAAA If the price of a slice of cake is $4, the price of a slice of pie is $2, and Caroline spends her entire budget of $10, she will choose to buy of pie and of cake. Now, suppose that cake goes on sale, and its price decreases to $2. Caroline's utility is now maximized if she buys of pie and of cake. Suppose the price of pie is fixed at $2, and Caroline's budget is fixed at $10. On the graph, use the blue line (circle symbols) to plot Frances's demand for cake. Do this by placing one blue point (circle symbol) on Frances's demand for cake when the price is $4 and the second blue point on Frances's demand for cake when the price is $2. Frances's Demand 1 2 3 4 5 QUANTITY (Slices of cake) PRICE (Dollars per slice) Caroline has a $10 dessert budget that she uses to buy pie and cake. Assume the price of pie (Pp) is fixed at $2. Table A shows Caroline's marginal utility (MU) and marginal utility per dollar () she receives from the first through fifth slices of pie she buys each week. Table B shows the same information for cake when the price of a slice of cake (Pc) is either $4 or $2. Assume that Caroline is a rational consumer who wants to maximize her utility. Table A Pie MU MU/P (Slices) (Utils) (If P=2) 30 15 1. 24 12 20 10 14 7 4. 6 5 Table B Cake MU MU/P (Slices) (Utils) (If P=$4) (If P=$2) 40 10 20 32 8 16 24 12 16 4. 4 4. 1 2 5 AAAAA AAAAA If the price of a slice of cake is $4, the price of a slice of pie is $2, and Caroline spends her entire budget of $10, she will choose to buy of pie and of cake. Now, suppose that cake goes on sale, and its price decreases to $2. Caroline's utility is now maximized if she buys of pie and of cake. Suppose the price of pie is fixed at $2, and Caroline's budget is fixed at $10. On the graph, use the blue line (circle symbols) to plot Frances's demand for cake. Do this by placing one blue point (circle symbol) on Frances's demand for cake when the price is $4 and the second blue point on Frances's demand for cake when the price is $2. Frances's Demand 1 2 3 4 5 QUANTITY (Slices of cake) PRICE (Dollars per slice) Caroline has a $10 dessert budget that she uses to buy pie and cake. Assume the price of pie (Pp) is fixed at $2. Table A shows Caroline's marginal utility (MU) and marginal utility per dollar () she receives from the first through fifth slices of pie she buys each week. Table B shows the same information for cake when the price of a slice of cake (Pc) is either $4 or $2. Assume that Caroline is a rational consumer who wants to maximize her utility. Table A Pie MU MU/P (Slices) (Utils) (If P=2) 30 15 1. 24 12 20 10 14 7 4. 6 5 Table B Cake MU MU/P (Slices) (Utils) (If P=$4) (If P=$2) 40 10 20 32 8 16 24 12 16 4. 4 4. 1 2 5 AAAAA AAAAA If the price of a slice of cake is $4, the price of a slice of pie is $2, and Caroline spends her entire budget of $10, she will choose to buy of pie and of cake. Now, suppose that cake goes on sale, and its price decreases to $2. Caroline's utility is now maximized if she buys of pie and of cake. Suppose the price of pie is fixed at $2, and Caroline's budget is fixed at $10. On the graph, use the blue line (circle symbols) to plot Frances's demand for cake. Do this by placing one blue point (circle symbol) on Frances's demand for cake when the price is $4 and the second blue point on Frances's demand for cake when the price is $2. Frances's Demand 1 2 3 4 5 QUANTITY (Slices of cake) PRICE (Dollars per slice) Caroline has a $10 dessert budget that she uses to buy pie and cake. Assume the price of pie (Pp) is fixed at $2. Table A shows Caroline's marginal utility (MU) and marginal utility per dollar () she receives from the first through fifth slices of pie she buys each week. Table B shows the same information for cake when the price of a slice of cake (Pc) is either $4 or $2. Assume that Caroline is a rational consumer who wants to maximize her utility. Table A Pie MU MU/P (Slices) (Utils) (If P=2) 30 15 1. 24 12 20 10 14 7 4. 6 5 Table B Cake MU MU/P (Slices) (Utils) (If P=$4) (If P=$2) 40 10 20 32 8 16 24 12 16 4. 4 4. 1 2 5 AAAAA AAAAA If the price of a slice of cake is $4, the price of a slice of pie is $2, and Caroline spends her entire budget of $10, she will choose to buy of pie and of cake. Now, suppose that cake goes on sale, and its price decreases to $2. Caroline's utility is now maximized if she buys of pie and of cake. Suppose the price of pie is fixed at $2, and Caroline's budget is fixed at $10. On the graph, use the blue line (circle symbols) to plot Frances's demand for cake. Do this by placing one blue point (circle symbol) on Frances's demand for cake when the price is $4 and the second blue point on Frances's demand for cake when the price is $2. Frances's Demand 1 2 3 4 5 QUANTITY (Slices of cake) PRICE (Dollars per slice)
Expert Answer:
Answer rating: 100% (QA)
A utility maximizing consumer consumes in decreasing order of marginal utility of dollars The utilit... View the full answer

Related Book For 
Elementary Principles of Chemical Processes
ISBN: 978-0471720638
3rd Edition
Authors: Richard M. Felder, Ronald W. Rousseau
Posted Date:
Students also viewed these economics questions
-
The initial investment for each project is fixed at 2 million dollars. Company discount all projects based on WACC. Further, all the projects are equally risky projects and the company uses only debt...
-
Assume the price of gas across gas stations in Boston at any particular time has a normal distribution with unknown mean and variance. In order to estimate the expected price on a given day, you...
-
WEL provides Lauren with a vehicle that she uses to drive her clients on tours. The vehicle was used by Lauren throughout 2020, aside form the three months she was off work. WEL required her to...
-
Ira Icandoit is a staff auditor in the internal audit function of a small manufacturing company located in western Kansas. Ira recently completed a professional development course on a statistical...
-
You are analyzing the results of a consumer survey of a product, rated on a scale from 1 to 10. For the 130 consumers who described themselves as outgoing, the average rating was 8.36, and the...
-
Compounds A and B are carboxylic acids. Identify each one on the basis of its 1H NMR spectrum. (a) Compound A (C3H5ClO2) (Figure 19.10). (b) Compound B (C9H9NO4) has a nitro group attached to an...
-
The third-order Runge-Kutta formula is given by \[\vec{X}_{i+1}=\vec{X}_{i}+\frac{1}{6}\left(\vec{K}_{1}+4 \vec{K}_{2}+\vec{K}_{3} ight)\] where \[\begin{gathered}\vec{K}_{1}=h...
-
In 2010, the Keenan Company paid dividends totaling $3.6 million on net income of $10.8 million. The year was a normal one, and earnings have grown at a constant rate of 10% for the past 10 years....
-
a) Let M = (90, 91, 92, 93, 94, qs}, {a, b, c), qo, fs, {q1,93, 95}) be the Deterministic Finite Automaton (DFA) with state transition, fs is defined as in Table 3. fs State a b C 90 91 90 91 91 92...
-
Modify the sentence-generator program of Case Study so that it inputs its vocabulary from a set of text files at startup. The filenames are nouns.txt, verbs. txt, articles.txt, and prepositions.txt....
-
The oxidation of carbon monoxide on palladium single crystals at low pressures and temperatures between 450 to 550 K follows an experimental rate law that is first order in O2 and inverse first order...
-
Why does the net value of a cross-currency swap fluctuate continuously?
-
Why are cross-currency swaps compared to series of long-dated forward contracts?
-
How can contractual and financial hedging be harnessed to reduce operating exposure to currency risk? What are the limitations of this approach?
-
What is securitization? Why does it lower the cost of consumer financing?
-
How can manufacturing policies be used to manage operating exposure to currency risk?
-
In a response to a crisis or shock, protectionism tends to arise. The global finance crisis in 2008 is an example of this. The Covid-19 pandemic is another recent example. a) Protectionism is...
-
6 (a) Briefly develop a mathematical model of the behaviour of a copper-twisted pair cable (b) Derive the magnetic energy from: w given that: K + w, where the - - k symbols have their usual meaning...
-
Liquid hydrazine (SO = 0.82) undergoes a family of decomposition reactions that can be represented by the stoichiometric expression 3 N 2 H 4 6x H 2 + (1 + 2x) N 2 + (4 4x) NH 3 (a) For what range...
-
A venturi meter is a device to measure fluid flow rates, which in its operation resembles the orifice meter (Section 3.2b). It consists of a tapered Constriction in a line, with pressure taps leading...
-
A fuel gas containing 85.0 mole% methane and the balance ethane is burned completely with pure oxygen at 25C and the products are brought back down to 25C. (a) Suppose the reactor is continuous. Take...
-
In capital budgeting, a distinction has been made regarding the process of "assessment" as being distinctively different than "evaluation." What is the difference and why is it important?
-
If bond money tends to be the least expensive cost of capital, why do we bother with the WACC in project analysis? It seems like the cost of equity is hard to estimate, and maybe we are just guessing...
-
In developing a capital budgeting portfolio, there are times when a project with a lower return is squeezed in to the budget but a higher-return project is excluded. How can this be fair? Wouldn't...

Study smarter with the SolutionInn App