

Question: Carryover data for H2S was obtained using packed columns. The column has a height of 8 feet and a diameter of 1 foot. The gas
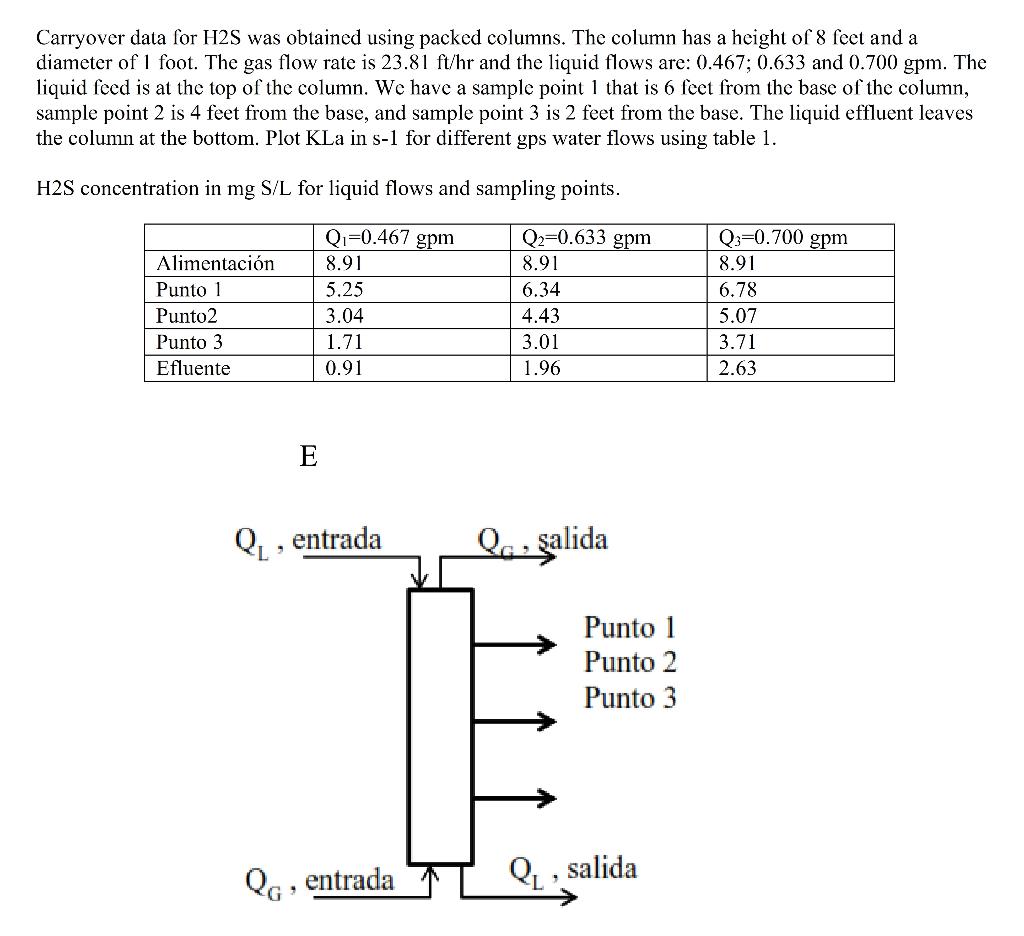
Carryover data for H2S was obtained using packed columns. The column has a height of 8 feet and a diameter of 1 foot. The gas flow rate is 23.81 ft/hr and the liquid flows are: 0.467; 0.633 and 0.700 gpm. The liquid feed is at the top of the column. We have a sample point 1 that is 6 feet from the base of the column, sample point 2 is 4 feet from the base, and sample point 3 is 2 feet from the base. The liquid effluent leaves the column at the bottom. Plot KLa in s-1 for different gps water flows using table 1. H2S concentration in mg S/L for liquid flows and sampling points. QI=0.467 gpm Alimentacin Punto 1 Punto 2 Punto 3 Efluente 8.91 5.25 3.04 1.71 0.91 Q2=0.633 gpm 8.91 6.34 4.43 3.01 1.96 Q3=0.700 gpm 8.91 6.78 5.07 3.71 2.63 E Q , entrada Qo, salida Punto 1 Punto 2 Punto 3 Qo, entrada QL, salida
Step by Step Solution
There are 3 Steps involved in it

Get step-by-step solutions from verified subject matter experts