

Question: Case # 1 Forecasting Methods California Umbrella Corporation is a premier custom umbrella manufacturer and supplier since 2 0 0 1 . Quarterly sales (
Case # Forecasting Methods
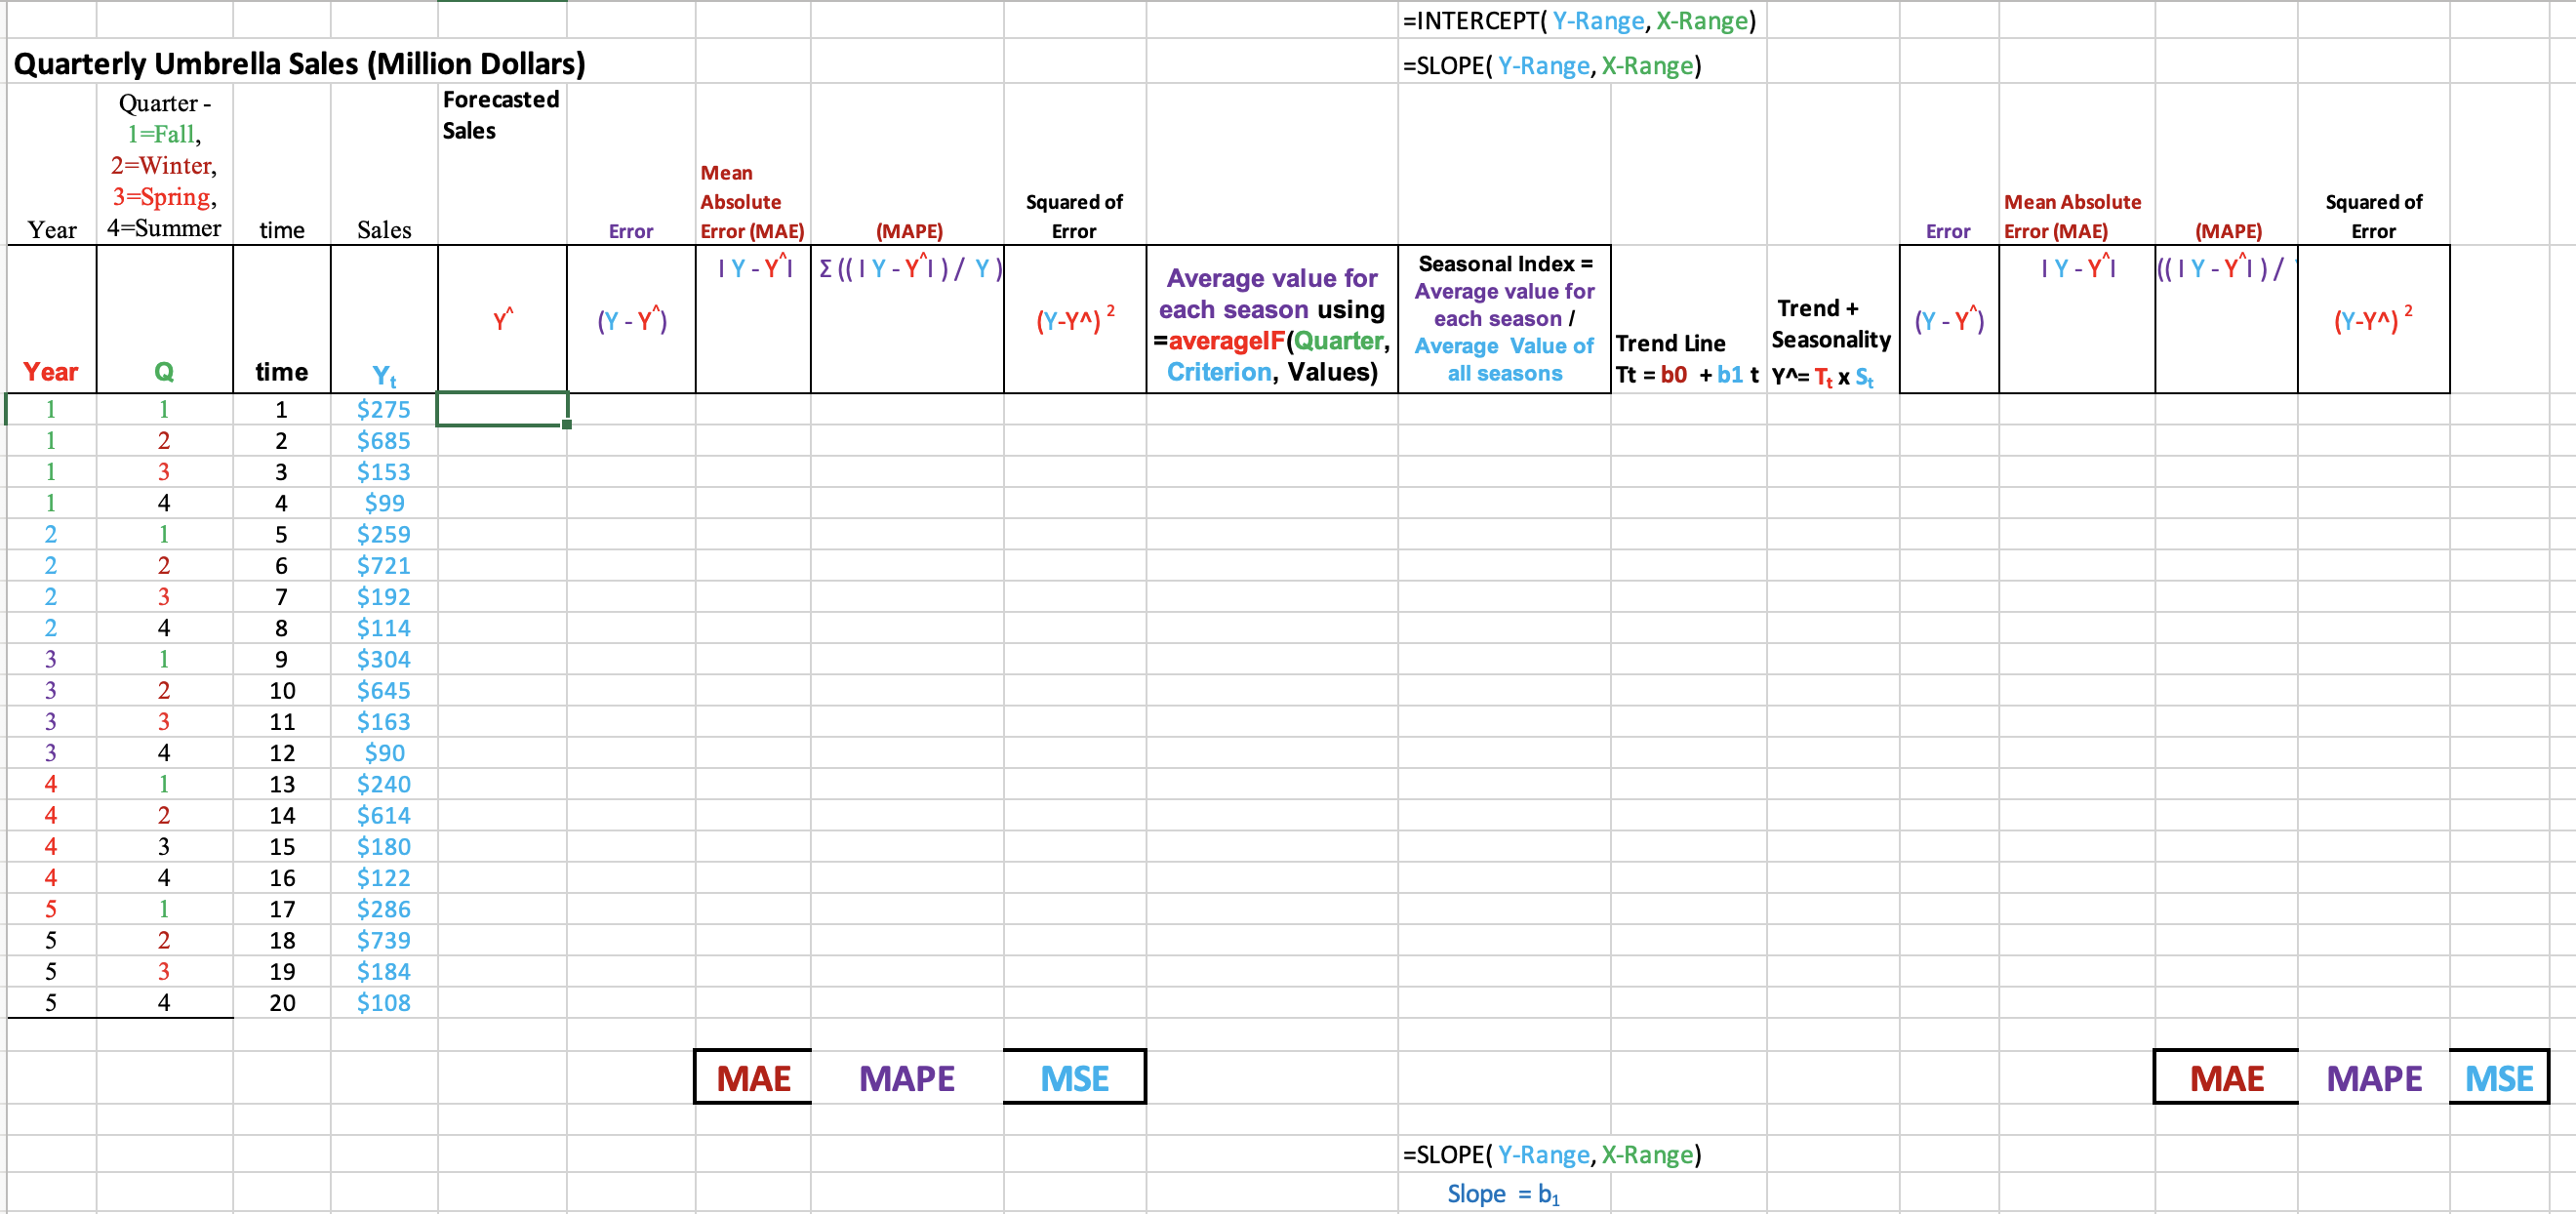
California Umbrella Corporation is a premier custom umbrella manufacturer and supplier since Quarterly sales in Millions of $ for the last years is reported in Excel file Quarterly Umbrella SalesQuarter Fall, Quarter Winter, Quarter Spring, Quarter Summer
The idea of this case is to compare and use different forecasting methods that would be the best fit for this data set.
Answer the following questions, on the space that is provided for each section. Use Excel for calculations, but no need show your calculations. Upload your answer using the Turnitin Assignment link for the computer projects.
Questions:
a Develop a quarter moving average for this time series. Forecast the sale for the first quarter of year then calculate the MSE and the MAPE for the model. No need to show your calculations, just write down the answers on appropriate boxes below, round up your numbers to decimal points
Forecast for first quarter of year
Mean Squared Error MSE
Mean Absolute Percentage Error MAPE
b Develop a quarter weighted moving average for this time series by assigning weight for the most recent value and an equal weight for preceding time periods.
Forecast for first quarter of year
Mean Squared Error MSE
Mean Absolute Percentage Error MAPE
c As a follow up of your answer to part b calculate the optimal for quarter weighted moving average, use the optimal and calculate the following:.
Optimal
Forecast for first quarter of year
Mean Absolute Percentage Error MAPE for the optimal
d Use for the exponential method and calculate the following:.
Forecast for first quarter of year
Mean Squared Error MSE
Mean Absolute Percentage Error MAPE
e As a follow up of your answer to part d calculate the optimal for the exponential method use the optimal and calculate the following:.
Optimal
Forecast for first quarter of year
Mean Squared Error for the optimal MSE
f Now, using the MSE method, compare the above models and decide which method provides the most accurate forecast. Why? Explain. Does MAPE method confirm your recommendation based on MSE?
g Use the Trend Line Method and make a forecast for the next quarters.No need to show your calculations, round up your numbers to decimal points
Equation for the Trend Line
Forecast for Q year
Forecast for Q year
Forecast for Q year
Forecast for Q year
h Use the Trend Seasonality method to calculate and interpret the seasonal factor for each quarter.Quarter Fall, Quarter Winter, Quarter Spring, Quarter Summer
No need to show your calculations, round up your numbers to decimal points
Interpretation
S
S
S
S
i Use the Trend Seasonality method and make a forecast for the next quarters.No need to show your calculations, round up your numbers to decimal points
Forecast for Q year
Forecast for Q year
Forecast for Q year
Forecast for Q year
j Calculate the MAPE for parts f and h the Trend Line Method and the Trend Seasonality method which method should be used and why?No need to show your calculations, round up your numbers to decimal points
Mean Absolute Percentage Error MAPE for the Trend Line Method
Mean Absolute Percentage Error MAPE for the Trend Seasonality Method
Mean Absolute Percentage Error MSE for the Trend Line Method
Mean Absolute Percentage Error MSE for the Trend Seasonality Method
Step by Step Solution
There are 3 Steps involved in it
1 Expert Approved Answer
Step: 1 Unlock

Question Has Been Solved by an Expert!
Get step-by-step solutions from verified subject matter experts
Step: 2 Unlock
Step: 3 Unlock