

Question: Case 1 Matlab Code to call function: % ------------------------------------------------------------------------- % Case 1: Given a history of weekly sales data, % estimate likely longterm average sales
Case 1 Matlab
Code to call function:
% -------------------------------------------------------------------------
% Case 1: Given a history of weekly sales data,
% estimate likely longterm average sales and variability.
% INPUTS:
% nweeks, number of weeks of sales data
% salesSet, set of weekly sales data
% binEdges, bin boundaries: min to max in uniform width (see binCounts)
% OUTPUTS:
% salesAvg, mean of weekly sales
% salesStdDev, standard deviation of weekly sales
% binCounts, salesSet1 data sorted into bins (see binEdges)
% -------------------------------------------------------------------------
% SETUP SECTION -----------------------------------------------------------
% generate the sales data
nweeks= 52;
mu= 1000; % sales average per week
sigma= 100; % sales standard deviation
load('salesSet.mat'); % distribution data
% set up histogram structure
binEdgemin= 500;
binEdgemax= 1500;
binwidth= 100;
binEdges= binEdgemin:binwidth:binEdgemax; % row vec [5500,600,700,...]
% SIMULATION SECTION ------------------------------------------------------
[salesAvg,salesStdDev,binCounts]=Sales_1_fcn(nweeks,salesSet,binEdges);
% REPORT SECTION -------------------------------------------------------
fprintf(' Setup 1: ');
fprintf(' nweeks=%5.0f ',nweeks);
fprintf(' mu= %5.0f ',mu); % mean of normal distrib for sales
fprintf(' sigma= %5.0f ',sigma); % std dev for sales
% results
fprintf(' Results 1: ');
fprintf(' salesAvg= %6.0f ',salesAvg);
fprintf(' salesStdDev=%6.0f ',salesStdDev);
salesMin= min(salesSet);
fprintf(' sales min= %6.0f ',salesMin);
salesMax= max(salesSet);
fprintf(' sales max= %6.0f ',salesMax);
nbins= length(binCounts);
fmta= [' binCounts= [',repmat('%4.0f',1,nbins),'] '];
fprintf(fmta,binCounts(1:nbins));
% figures to aid interpretation of results
figure(1)
x= 1:nweeks;
plot(x,salesSet);
title('Fig.1. History of weekly sales')
xlabel('weeks');
ylabel('sales');
grid on;
%pause
figure(2)
histogram(salesSet,binEdges);
title('Fig.2. Histogram of sales history');
grid on;
fprintf(' ');
% -------------------------------------------------------------------------
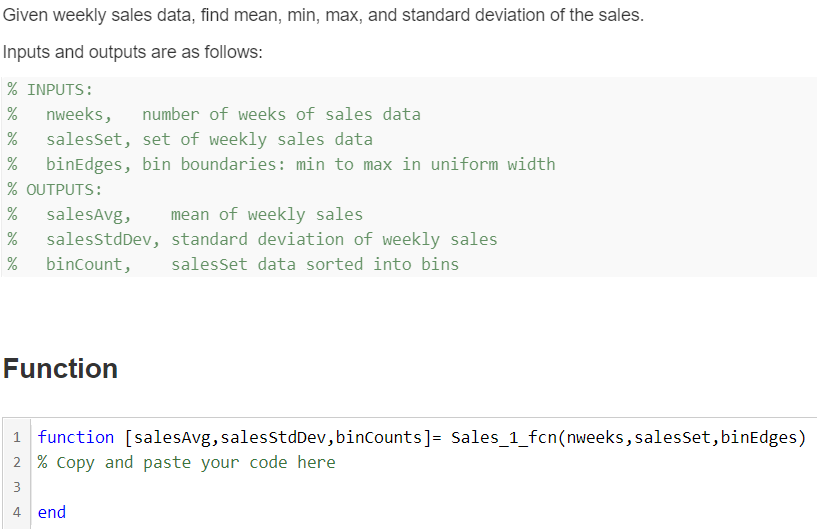
Given weekly sales data, find mean, min, max, and standard deviation of the sales. Inputs and outputs are as follows: % INPUTS: % nweeks, number of weeks of sales data % salesset, set of weekly sales data % binEdges, bin boundaries: min to max in uniform width % OUTPUTS: % salesAvg, mean of weekly sales % salesStdDev, standard deviation of weekly sales % binCount, salesset data sorted into bins Function 1 function [salesAvg, salesStdDev, binCounts]= Sales_1_fcn(nweeks, salesset, binEdges) 2 % Copy and paste your code here 4 end Given weekly sales data, find mean, min, max, and standard deviation of the sales. Inputs and outputs are as follows: % INPUTS: % nweeks, number of weeks of sales data % salesset, set of weekly sales data % binEdges, bin boundaries: min to max in uniform width % OUTPUTS: % salesAvg, mean of weekly sales % salesStdDev, standard deviation of weekly sales % binCount, salesset data sorted into bins Function 1 function [salesAvg, salesStdDev, binCounts]= Sales_1_fcn(nweeks, salesset, binEdges) 2 % Copy and paste your code here 4 end
Step by Step Solution
There are 3 Steps involved in it

Get step-by-step solutions from verified subject matter experts