

Question: Case 3. Forecasting Residential Homes (30 marks) Attached Excel spreadsheeted contains data on the number of new constructions for residential homes, per month, in
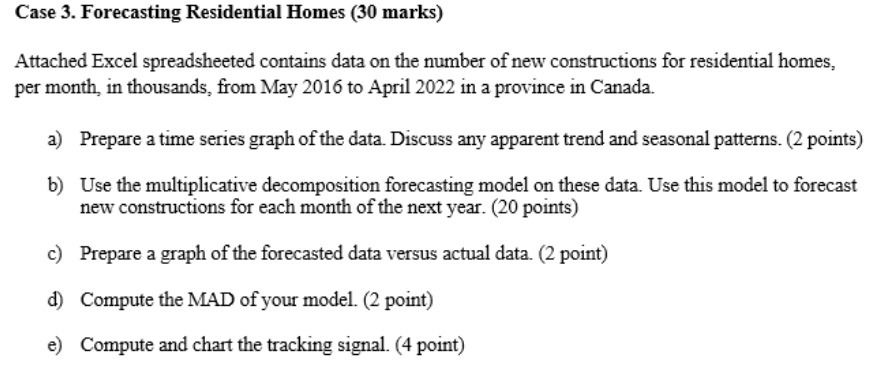
Case 3. Forecasting Residential Homes (30 marks) Attached Excel spreadsheeted contains data on the number of new constructions for residential homes, per month, in thousands, from May 2016 to April 2022 in a province in Canada. a) Prepare a time series graph of the data. Discuss any apparent trend and seasonal patterns. (2 points) b) Use the multiplicative decomposition forecasting model on these data. Use this model to forecast new constructions for each month of the next year. (20 points) c) Prepare a graph of the forecasted data versus actual data. (2 point) d) Compute the MAD of your model. (2 point) e) Compute and chart the tracking signal. (4 point)
Step by Step Solution
There are 3 Steps involved in it

Get step-by-step solutions from verified subject matter experts