Question: Case ABCtronics: Manufacturing, Quality Control, and Client Interfaces Please give me more details.. Thank you! Customer Feedback Assuming that customer scores in Table 2 follow

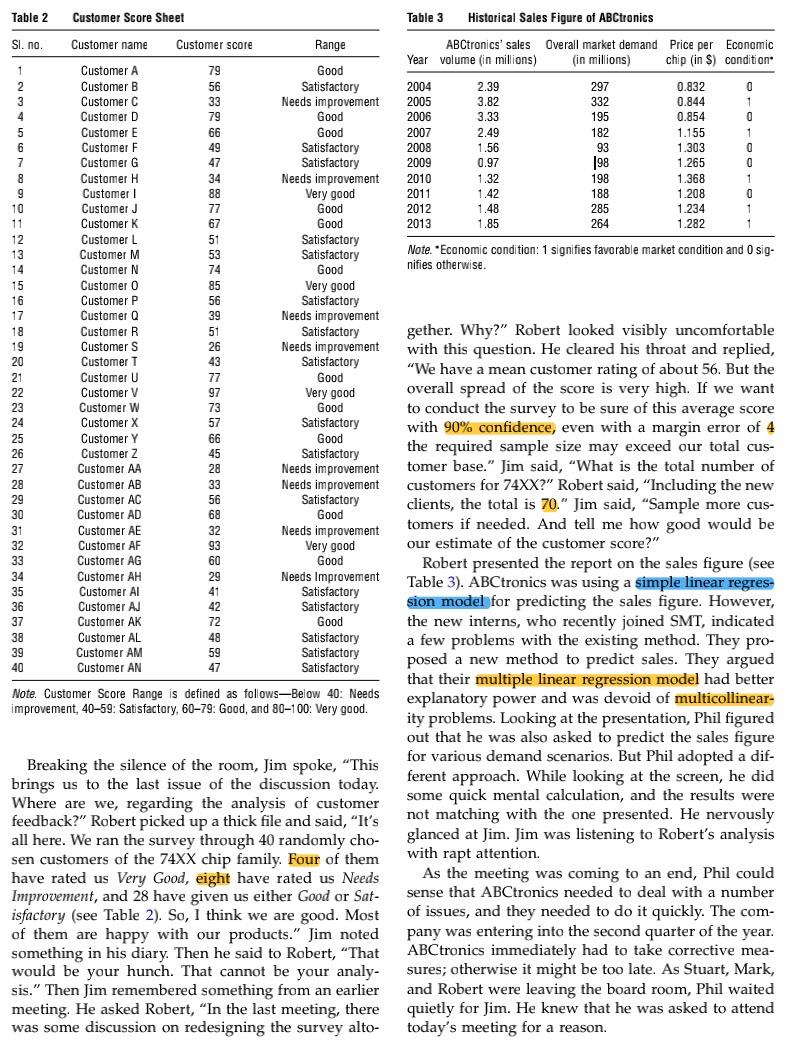
Case ABCtronics: Manufacturing, Quality Control, and Client Interfaces Please give me more details.. Thank you! Customer Feedback Assuming that customer scores in Table 2 follow a normal distribution, find the parameters of this distribution. Do you agree with Robert's analysis of the customer scores? Find the 90% confidence interval for the average customer score. For the given margin of error 4, what do you think would be the minimum sample size for analyzing the mean customer score with 90% confidence? 1. What is E[X] and Var[X] of the distribution? 2. What is the average score? What type does it fit? Good or Need improvement? 3. Statistics problem 4. Margin of error = z X Vn o Table 2 Customer Score Sheet Table 3 Historical Sales Figure of ABCtronics Sl. no. Customer name Customer score Range ABCtronics' sales Overall market demand Price per Economic Year volume (in millions) (in millions) chip (in %) condition 2004 2005 2006 2007 2008 2009 2010 2011 2012 2013 2.39 3.82 3.33 2.49 1.56 0.97 1.32 1.42 1.48 1.85 297 332 195 182 93 98 198 188 285 264 0.832 0.844 0.854 1.155 1.303 1.265 1.368 1.208 1.234 1.282 0 1 0 1 0 0 1 0 1 1 Customer Note. Economic condition: 1 signifies favorable market condition and 0 sig- nifies otherwise. 1 Customer A 79 Good 2 Customer B 56 Satisfactory 3 Customer C 33 Needs improvement 4 Customer D 79 Good 5 Customer E 66 Good 6 Customer F 49 Satisfactory 7 Customer G 47 Satisfactory 8 Customer H 34 Needs improvement 9 Customer 88 Very good 10 Customer J 77 Good 11 Customer K 67 Good 12 3 51 Satisfactory 13 Customer M 53 Satisfactory 14 Customer N 74 Good 15 Customer 0 85 Very good 16 Customer P 56 Satisfactory 17 Customer Q 39 Needs improvement 18 Customer R 51 Satisfactory 19 Customer S 26 Needs improvement 20 Customer 43 Satisfactory 21 Customer U 77 Good 22 Customer V 97 Very good 23 Customer W 73 24 Customer X 57 Satisfactory Customer Y Good Customer Z Satisfactory Customer AA 28 Needs improvement 28 Customer AB 33 Needs improvement 29 Customer AC 30 56 Satisfactory Customer AD 68 Good Customer AE 32 Needs improvement Customer AF 93 Very good Cuctos Customer AG 60 Good Customer AH 29 Needs Improvement Customer AI 41 Satisfactory Customer AJ 42 Satisfactory 37 Customer AK 72 Good 38 Customer AL 48 Satisfactory 39 Customer AM 59 Satisfactory 40 Customer AN 47 Satisfactory Note. Customer Score Range is defined as foliows-Below 40: Needs improvement, 40-59: Satisfactory, 6079: Good, and 80-100: Very good. Good gether. Why?" Robert looked visibly uncomfortable with this question. He cleared his throat and replied, "We have a mean customer rating of about 56. But the overall spread of the score is very high. If we want to conduct the survey to be sure of this average score with 90% confidence, even with a margin error of 4 the required sample size may exceed our total cus- tomer base." Jim said, "What is the total number of customers for 74XX?" Robert said, "Including the new clients, the total is 70." Jim said, "Sample more cus- tomers if needed. And tell me how good would be our estimate of the customer score?" Robert presented the report on the sales figure (see Table 3). ABCtronics was using a simple linear regres sion model for predicting the sales figure. However, the new interns, who recently joined SMT, indicated a few problems with the existing method. They pro- posed a new method to predict sales. They argued that their multiple linear regression model had better explanatory power and was devoid of multicollinear- ity problems. Looking at the presentation, Phil figured out that he was also asked to predict the sales figure for various demand scenarios. But Phil adopted a dif- ferent approach. While looking at the screen, he did some quick mental calculation, and the results were not matching with the one presented. He nervously glanced at Jim. Jim was listening to Robert's analysis with rapt attention As the meeti ming to an end, Phil could sense that ABCtronics needed to deal with a number of issues, and they needed to do it quickly. The com- pany was entering into the second quarter of the year. ABCtronics immediately had to take corrective mea- sures; otherwise it might be too late. As Stuart, Mark, and Robert were leaving the board room, Phil waited quietly for Jim. He knew that he was asked to attend today's meeting for a reason. Breaking the silence of the room, Jim spoke, "This brings us to the last issue of the discussion today. Where are we, regarding the analysis of customer feedback?" Robert picked up a thick file and said, "It's all here. We ran the survey through 40 randomly cho- sen customers of the 74XX chip family. Four of them have rated us Very Good, eight have rated us Needs Improvement, and 28 have given either Good or Sat- isfactory (see Table 2). So, I think we are good. Most of them are happy with our products." Jim noted something in his diary. Then he said to Robert, "That would be your hunch. That cannot be your analy- sis." Then Jim remembered something from an earlier meeting. He asked Robert, In the last meeting, there was some discussion on redesigning the survey alto


