

Question: Case Analysis read the two cases below words :500 The topic of this paper is Operations Management and Value creation: Lessons from cases. Summarize both
Case Analysis
read the two cases below
words :500
The topic of this paper is Operations Management and Value creation: Lessons from cases. Summarize both cases (Roche and Atlantic Animal Hosptial) and the problems the company that the cases follow in your own words. (5pts).
Use both examples/cases as critical inputs to evaluate the concepts of operations management and value creation. (5pts).
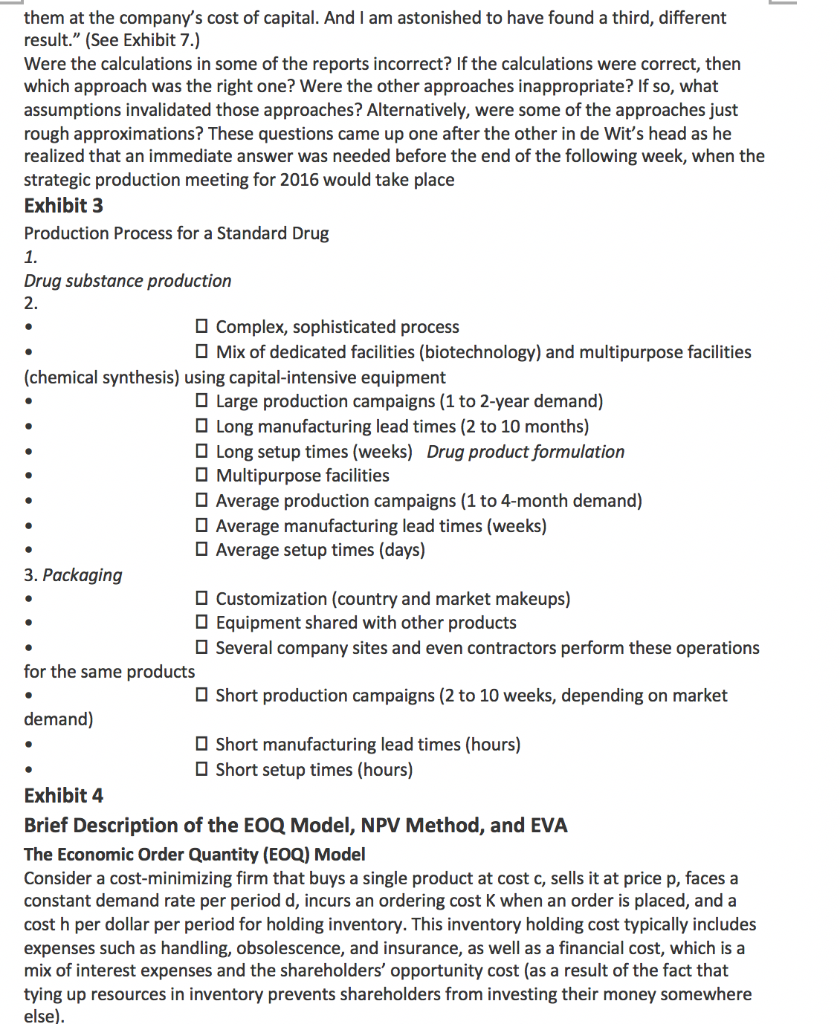
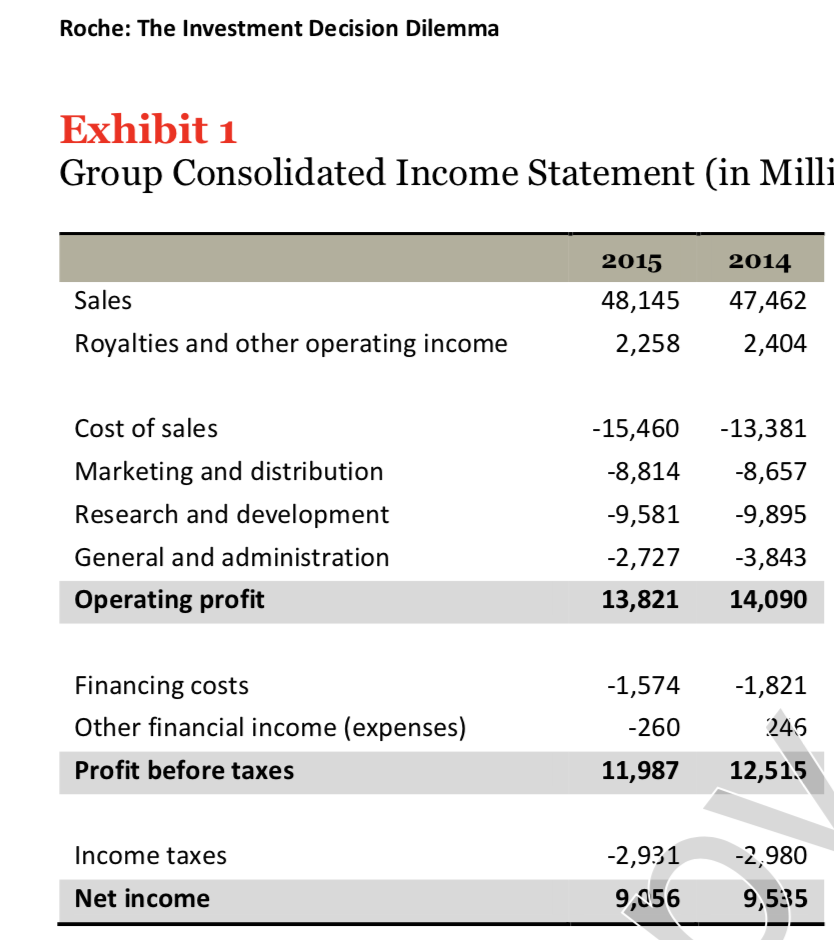
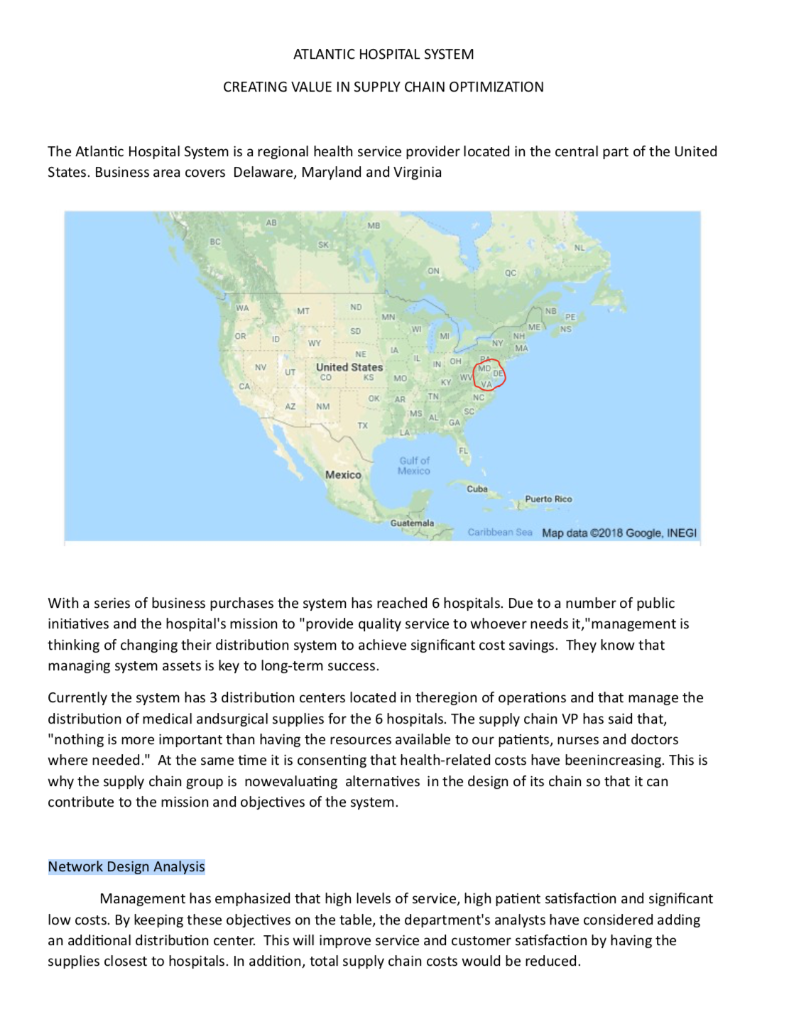

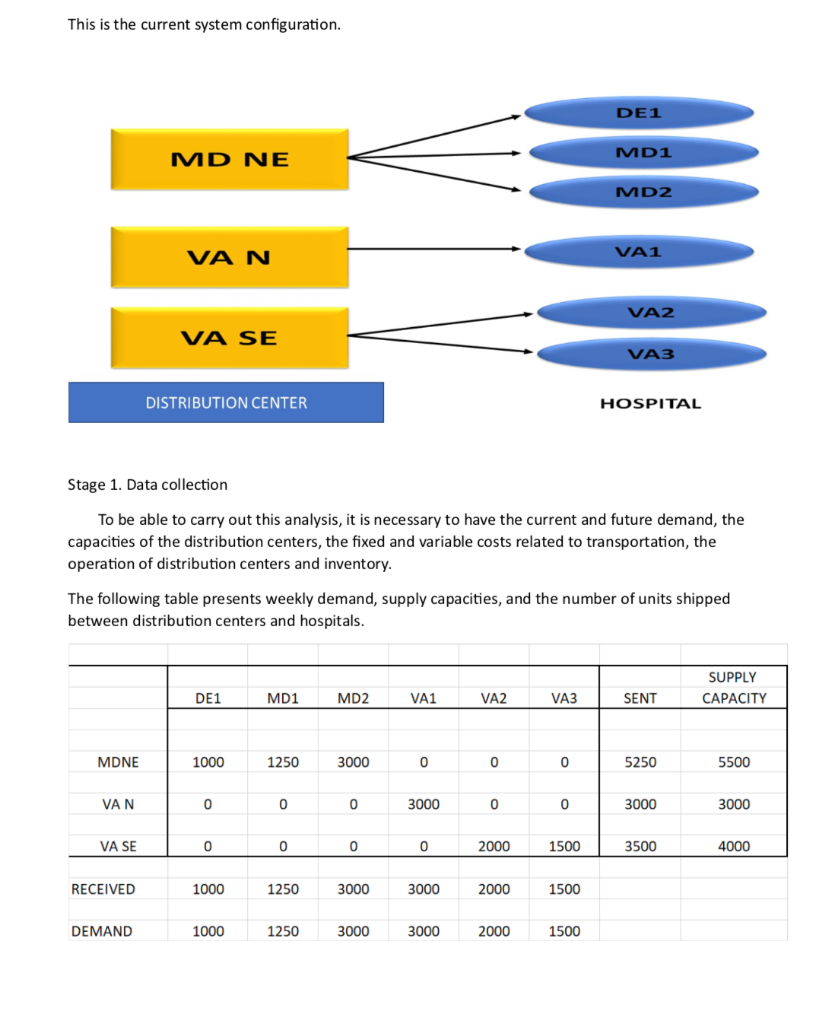
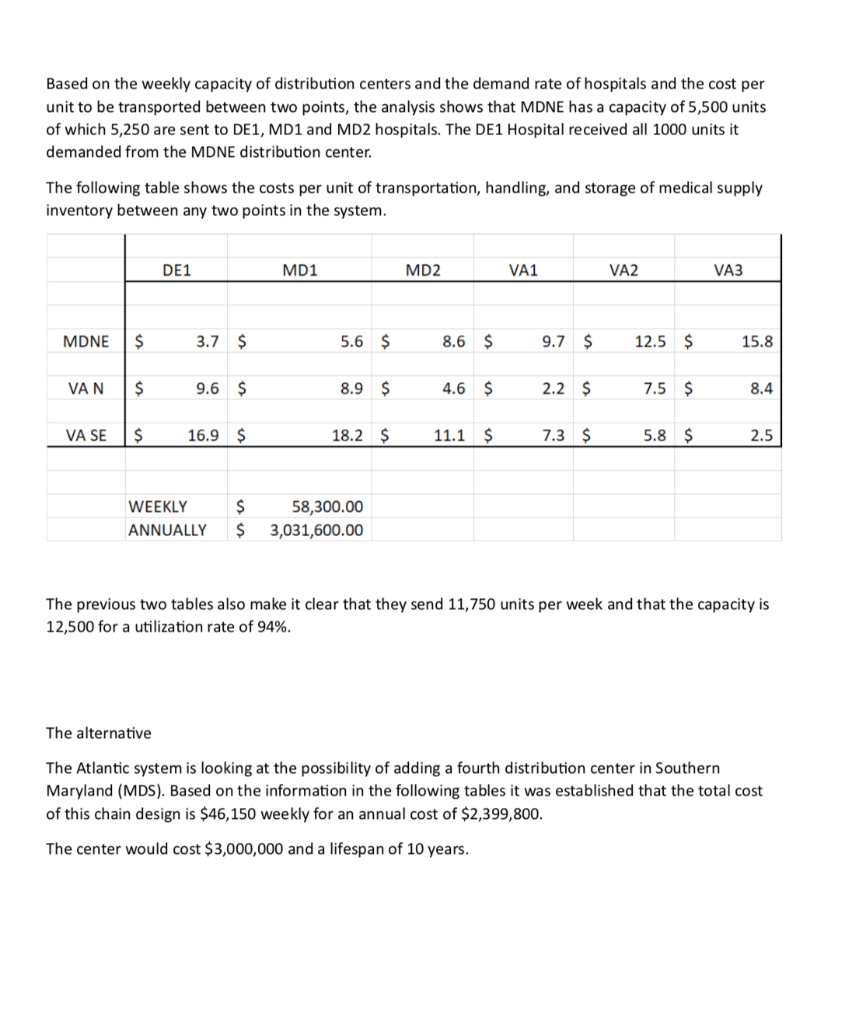
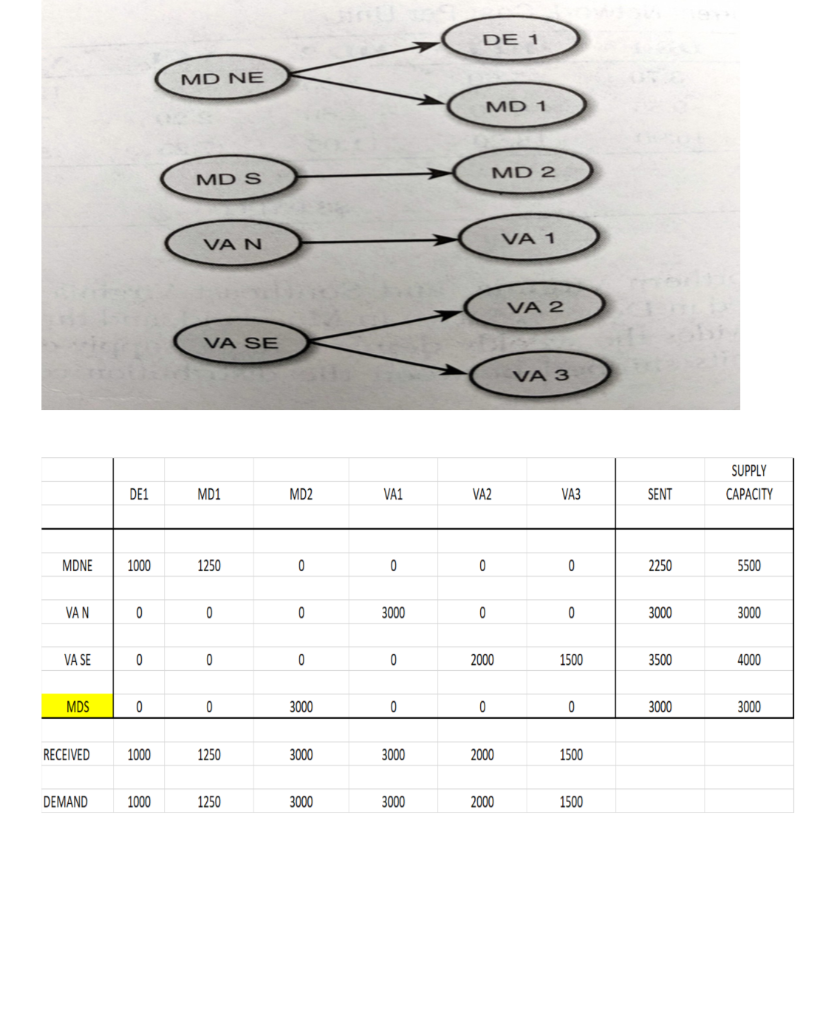
Roche: The Investment Decision Dilemma Paul de Wit, head of supply performance in the pharmaceuticals division at Roche, read the three reports again and still remained perplexed. If the question was the same, how could the three answers be different? He knew that the final decision that he had to make about how best to determine the appropriate size of the campaign batches would have a big impact on the company's production costs, so he wanted to make sure that he knew what was going on before making the final proposal to the supply planning committee. Background1 As of 2016, F. Hoffmann-La Roche Ltd., based in Basel, Switzerland, was one of the five largest pharmaceutical corporations in the world, 2 with sales of more than 50 billion Swiss francs3 in 180 countries and more than 80,000 employees worldwide. The company was created in 1896 in Switzerland and, since then, had enjoyed more than a century of continued expansion, internationalization, and diversification. Popular products in its portfolio included Tamiflu, used to prevent and treat influenza, and MabThera, Avastin and Herceptin, leading oncology drugs. These shared its portfolio with less well-known products, such as the hepatitis drug Pegasys and the macular degeneration therapy Lucentis, some of which had 2015 annual sales of more than 1 billion francs each. Between 2000 and 2015, Roche divested some noncore operations, such as its vitamin and fine chemical businesses, to focus on two main segments: pharmaceuticals and diagnostics. The pharmaceutical business unit, which produced biologic and small-molecule products, provided 80% of sales, with oncology drugs making the largest sales contributions. In order to expand its pharmaceutical product offerings and fight against patent expirations and other increasing competitive pressures, the company conducted widespread research and development programs, and it had more than 100 drugs in the pipeline. The diagnostics division offered advanced DNA tests, diabetes monitoring supplies, and point-of-care diagnostics used in a variety of health-care settings. 4 In both pharmaceuticals and diagnostics, Roche focused on innovative products and personalized health care, targeting unmet medical needs and keeping the patient at the core of everything the company did. As with other leading companies in the industry, only a small percentage of Roche's enormous investment in R&D was converted into commercial products. Such investments had to be recouped with large gross margins and returns for its shareholders. (See Exhibits 1 and 2.) Production costs were high because of the rigorous quality-compliance requirements. In fact, a quality problem in production could lead to an investigation (which could temporarily stop production), to a recall of a marketed product, or to a patient stock-out. Given that the company depended on a small number of highly profitable products, such quality-assurance issues could affect productivity significantly. This was one of the main reasons why Roche owned its key production facilities, together with the need to be flexible in a rapidly changing industry, the advantage of having development facilities next to factories, and the use of unique technologies. Manufacturing a specific drug was a complex task. Two main available methods were available to obtain the drug substance: synthesis and biotechnology. The goal of synthesis was to convert simpler components into the desired drug through a series of chemical reactions, whereas biotechnology involved the use of living organisms to produce a specific drug, sometimes using advanced techniques such as gene splicing or recombinant DNA technology.5 The Pharmaceutical Production Process The production process required several well-differentiated stages and usually started several months or even years before the drug would arrive at the distribution centers. The production process could be split into three main stages. (See Exhibit 3.) During the first stage, the drug substance was created. This process was, by far, the most expensive and sophisticated. It typically consisted of multiple steps, was very capital-intensive, and needed to comply with strict quality specifications and environmental safety regulations. The ability to use the drug substance in subsequent production phases critically depended on the successful execution of this stage. The second stage took the active substance as a raw material and formulated it into the different dosage forms by adding the excipients-that is, the inactive substance of the tablet or the inactive liquid in which the active substance was suspended. The third and final stage consisted of customizing the drug according to the market requirements: presentation (such as bottles and pills), prospect language, size, etc. After this customization process, the number of stock keeping units (SKUs) increased dramatically from a few dozen to several hundred. Managing so many SKUs represented a major challenge, given the near-100% level of customer service required and the shelf-life constraints of the drugs, which was typically two or three years. A critical decision in the manufacturing process was deciding on the campaign or batch size for the first stage at each facility since the setup costs could be considerable. (The cost of a complete setup could be as high as 1 million Swiss francs in some cases.) This was mostly due to the fact that setups often implied the complete shutdown of production facilities for a period of days or weeks (which would imply an enormous opportunity cost), along with expensive cleaning and maintenance operations to ensure the noncontamination of the process for the next campaign. Because of this, campaigns were typically of a size that meant a specific drug substance would be produced once a year or even every other year. The drug substance was kept in stock under quality-compliance conditions so that shorter campaigns could be run later for the subsequent steps. The Improvement Program In the period between 2000 and 2015, the leading pharmaceutical companies were under increasing pressure to reduce costs to maintain their profitability. The reasons included: 1) the increasingly demanding government regulations to have a new drug approved, which increased the cost and time to introduce a new drug in the market, 2) governments' need to reduce health-care costs, 3) the pressure of the industry's "followers," who did not usually invest in R&D but waited for patents to expire so they could sell generics at a significantly lower price, and 4) the increasing pressure from the international community for pharmaceutical companies to reduce the cost of drugs in developing countries (e.g., HIV/AIDS treatments.) In late 2015, Roche launched a renewed improvement program to reduce the cost of its products at several levels of the organization, with a special focus on production. Production costs represented roughly 40% of the total cost. A key driver of cost in the production phase was the size of the production campaigns during the first stage of the production process. Decreasing the total amount of batches was desirable for many reasons, the most important being that smaller batches lead to a decrease in inventory and operating working capital (OWC) along with improved flexibility and customer service. However, the huge setup costs had prevented this batch reduction from occurring for many years. In 2016, the production managers at Roche considered that it was time to assess whether such infrequent changes still made sense. The Mainclas Team7 De Wit was assigned the task of finding out the appropriate approach to determine the products' campaign size. Two other people were allocated to his team: Pierre Martin, a senior manager from the finance department, and Andreu Torregrosa, a graduate of a prestigious supply-chain program in Southern Europe. De Wit's idea was to answer this question for a simple, relatively- easy-to-study product and then scale up the solution, once the value drivers had been identified. For the initial assessment, he picked Mainclas, a product with fairly stable demand and sales and a long-enough history of production costs. Current coverage for this product was 1.28 years Another characteristic that made Mainclas suitable for the initial assessment was that this product was manufactured in only one facility that had plenty of capacity, so the team did not have to worry about potential production bottlenecks or other capacity constraints. Exhibit 5 provides data about this product in more detail. During the kick-off meeting, after some discussion about the different alternatives, de Wit proposed that Martin and Torregrosa, each work individually to come up with an answer and they would all meet again a week later and compare results. Then they could decide the next steps. To avoid discrepancies, the team members decided to make some common assumptions, such as taxes being zero and the cost of capital being 12%, and using the selected data shown in Exhibit 5. Later on, they could refine these assumptions if necessary. Martin and Torregrosa, agreed and started working individually. The Consensus Meeting One week later, the three team members gathered again to share their answers. De Wit asked Martin, from the finance department, to go first. Martin explained: "As I see it, all our decisions in the company have to aim to increase value for the shareholders. Therefore, we should choose the campaign size that maximizes the value of the company for them. As is customary for us in the finance department, I performed an EVA9 analysis to calculate the optimal campaign size. Here are my numbers." (See Exhibit 8.) After Martin's detailed explanation, Torregrosa said: "Well, I took a different angle for solving the problem. From the historical data, I realized that the demand for Mainclas, is very stable and so the problem almost exactly replicates the EOQ model10 that I learned in inventory theory during my master's program. According to this model, the objective should be minimizing the cost of the process rather than maximizing the value for the firm, and I believe that is why the results I obtained are different from Pierre's."(See Exhibit 6.) At this point, de Wit was really surprised that the two approaches differed from his. "I have to admit that I expected differences in some of the results but not in the methods themselves," he said. "Let me explain what I did. Since changing the campaign size will impact the firm's cash flows, then making a decision on the batch size is equivalent to undertaking an investment. Therefore, I followed a standard NPV calculation 11 for investment valuation, estimating the expected incremental cash flows-which depend on the batch size chosen-and discounting . them at the company's cost of capital. And I am astonished to have found a third, different result." (See Exhibit 7.) Were the calculations in some of the reports incorrect? If the calculations were correct, then which approach was the right one? Were the other approaches inappropriate? If so, what assumptions invalidated those approaches? Alternatively, were some of the approaches just rough approximations? These questions came up one after the other in de Wit's head as he realized that an immediate answer was needed before the end of the following week, when the strategic production meeting for 2016 would take place Exhibit 3 Production Process for a Standard Drug 1. Drug substance production 2. Complex, sophisticated process Mix of dedicated facilities (biotechnology) and multipurpose facilities (chemical synthesis) using capital-intensive equipment Large production campaigns (1 to 2-year demand) Long manufacturing lead times (2 to 10 months) Long setup times (weeks) Drug product formulation Multipurpose facilities Average production campaigns (1 to 4-month demand) O Average manufacturing lead times (weeks) Average setup times (days) 3. Packaging Customization (country and market makeups) Equipment shared with other products Several company sites and even contractors perform these operations for the same products Short production campaigns (2 to 10 weeks, depending on market demand) Short manufacturing lead times (hours) Short setup times (hours) Exhibit 4 Brief Description of the EOQ Model, NPV Method, and EVA The Economic Order Quantity (EOQ) Model Consider a cost-minimizing firm that buys a single product at cost c, sells it at price p, faces a constant demand rate per period d, incurs an ordering cost K when an order is placed, and a cost h per dollar per period for holding inventory. This inventory holding cost typically includes expenses such as handling, obsolescence, and insurance, as well as a financial cost, which is a mix of interest expenses and the shareholders' opportunity cost (as a result of the fact that tying up resources in inventory prevents shareholders from investing their money somewhere else). . In this model's standard version, the firm minimizes the total cost over a period of time (say, a year) by choosing the appropriate order quantity, q. Formally, the problem can be formulated as min C(q) = Kd + 1 cq h 20 q2 where the first term is the cost of incurring setups during a period, and the second term is the cost of holding inventory during the same period. The solution can be shown to be The Cash-Flow Discounting or Net Present Value (NPV) Method Cash-flow discounting gives the value created for shareholders when an investment is made. Future cash flows are discounted at an appropriate rate (the cost of capital for shareholders,) which takes into account the time value of money. The discount rate is usually (although not necessarily) assumed to be constant and reflects the expected return of the best alternative that has roughly the same risk as the investment under consideration. Only incremental cash flows are relevant. The effect of taxes is usually considered, since the impact of taxes on the decision might be a major driver of value. Costs already incurred when the decision is to be made (i.e., sunk costs) should not be included in the calculations. A discrete discount is typically used, periods being natural or financial years. Changes in OWC are considered as cash flows (they actually are), even if these are not recognized as expenses in the income statement. Cash-|| flow discounting gives the net present value (NPV) of an investment. Formally, Exhibit 4 (Continued) Economic Value Added (EVA)12 Economic value added (EVA) is an expression that combines book and market values. Formally, EVA is defined as EVA = NOPAT - (Eb + Db WACC t tt-1-1 where NOPAT is the net operating profit after taxes, Eb and Db are respectively the values of equity and debt of the firm evaluated at book value, and WACC is the weighted average cost of capital of the firm. Note that EVA is not a cash flow but a mix of accounting and market parameters: NOPAT, E and D are given at book value, but WACC is computed at market value. Subscripts indicate the period at which each variable should be calculated. For instance, for t = 1, we can write the following expression: EVA1 = NOPAT1 - (E0b + DbQWACC, which shows that the value of EVA in one period (say one year) will be the NOPAT of the next exercise less the money invested in year 0 (today) multiplied by the cost of capital of the firm. To analyze the economic impact of a decision, the stream EVAT, t = 1,2, ... may be discounted at the WACC to obtain the so-called market value added (MVA), as follows: Roche: The Investment Decision Dilemma Exhibit 1 Group Consolidated Income Statement (in Milli 2015 2014 Sales 48,145 47,462 Royalties and other operating income 2,258 2,404 Cost of sales -15,460 -13,381 Marketing and distribution -8,814 -8,657 Research and development -9,581 -9,895 General and administration -2,727 -3,843 Operating profit 13,821 14,090 -1,574 -1,821 Financing costs Other financial income (expenses) -260 245 Profit before taxes 11,987 12,515 Income taxes -2,931 -2,980 Net income 9,056 9,535 ATLANTIC HOSPITAL SYSTEM CREATING VALUE IN SUPPLY CHAIN OPTIMIZATION The Atlantic Hospital System is a regional health service provider located in the central part of the United States. Business area covers Delaware, Maryland and Virginia AB M BC ON go WA NO MT NB WN PE SO WI ME NH NS OR ID MI WY NY LA MA NE IL NV MD UT United States KS IN OH KY W MO CA VA OK AR TN NC AZ NM MS SC AL TX GA UA FL Gulf of Mexico Mexico Cuba Puerto Rico Guatemala Caribbean Sea Map data 2018 Google, INEGI With a series of business purchases the system has reached 6 hospitals. Due to a number of public initiatives and the hospital's mission to provide quality service to whoever needs it,"management is thinking of changing their distribution system to achieve significant cost savings. They know that managing system assets is key to long-term success. Currently the system has 3 distribution centers located in theregion of operations and that manage the distribution of medical andsurgical supplies for the 6 hospitals. The supply chain VP has said that, "nothing is more important than having the resources available to our patients, nurses and doctors where needed." At the same time it is consenting that health-related costs have beenincreasing. This is why the supply chain group is nowevaluating alternatives in the design of its chain so that it can contribute to the mission and objectives of the system. Network Design Analysis Management has emphasized that high levels of service, high patient satisfaction and significant low costs. By keeping these objectives on the table, the department's analysts have considered adding an additional distribution center. This will improve service and customer satisfaction by having the supplies closest to hospitals. In addition, total supply chain costs would be reduced. This is the current system configuration. DE1 MD1 MD NE MD2 VA1 VAN VA2 VA SE VA3 DISTRIBUTION CENTER HOSPITAL Stage 1. Data collection To be able to carry out this analysis, it is necessary to have the current and future demand, the capacities of the distribution centers, the fixed and variable costs related to transportation, the operation of distribution centers and inventory. The following table presents weekly demand, supply capacities, and the number of units shipped between distribution centers and hospitals. SUPPLY DE1 MD1 MD2 VA1 VA2 VA3 SENT CAPACITY MDNE 1000 1250 3000 0 0 0 5250 5500 VAN 0 0 0 3000 0 0 3000 3000 VA SE 0 0 0 0 2000 1500 3500 4000 RECEIVED 1000 1250 3000 3000 2000 1500 DEMAND 1000 1250 3000 3000 2000 1500 This is the current system configuration. DE1 MD1 MD NE MD2 VA1 VAN VA2 VA SE VA3 DISTRIBUTION CENTER HOSPITAL Stage 1. Data collection To be able to carry out this analysis, it is necessary to have the current and future demand, the capacities of the distribution centers, the fixed and variable costs related to transportation, the operation of distribution centers and inventory. The following table presents weekly demand, supply capacities, and the number of units shipped between distribution centers and hospitals. SUPPLY DE1 MD1 MD2 VA1 VA2 VA3 SENT CAPACITY MDNE 1000 1250 3000 0 0 0 5250 5500 VAN 0 0 0 3000 0 0 3000 3000 VA SE 0 0 0 0 2000 1500 3500 4000 RECEIVED 1000 1250 3000 3000 2000 1500 DEMAND 1000 1250 3000 3000 2000 1500 Based on the weekly capacity of distribution centers and the demand rate of hospitals and the cost per unit to be transported between two points, the analysis shows that MDNE has a capacity of 5,500 units of which 5,250 are sent to DE1, MD1 and MD2 hospitals. The DE1 Hospital received all 1000 units it demanded from the MDNE distribution center. The following table shows the costs per unit of transportation, handling, and storage of medical supply inventory between any two points in the system. DE1 MD1 MD2 VA1 VA2 VA3 MDNE $ 3.7 $ 5.6 $ 8.6 $ 9.7 $ 12.5 $ 15.8 VAN $ 9.6 $ 8.9 $ 4.6 $ 2.2 $ 7.5 $ 8.4 VA SE $ 16.9 $ 18.2 $ 11.1 $ 7.3 $ 5.8 $ 2.5 WEEKLY $ $ 58,300.00 3,031,600.00 ANNUALLY The previous two tables also make it clear that they send 11,750 units per week and that the capacity is 12,500 for a utilization rate of 94%. The alternative The Atlantic system is looking at the possibility of adding a fourth distribution center in Southern Maryland (MDS). Based on the information in the following tables it was established that the total cost of this chain design is $46,150 weekly for an annual cost of $2,399,800. The center would cost $3,000,000 and a lifespan of 10 years. DE 1 MD NE MD 1 MD 2 MD S VAN VA 1 VA 2 VA SE VA 3 SUPPLY DE1 MD1 MD2 VA1 VA2 VA3 SENT CAPACITY MDNE 1000 1250 0 0 0 0 2250 5500 VAN 0 0 0 3000 0 0 3000 3000 VA SE 0 0 0 0 2000 1500 3500 4000 MDS 0 0 3000 0 0 0 3000 3000 RECEIVED 1000 1250 3000 3000 2000 1500 DEMAND 1000 1250 3000 3000 2000 1500 Exhibit #1 How to analyze the situation 1 2 3 4 5 6 7 8 9 10 Cost Savings Depreciaton Income Betore Taxes Income Taxes NOPAT Invested Capital WACC Capital Charge Economic Value Added Present Value $0.00 of EVA Roche: The Investment Decision Dilemma Paul de Wit, head of supply performance in the pharmaceuticals division at Roche, read the three reports again and still remained perplexed. If the question was the same, how could the three answers be different? He knew that the final decision that he had to make about how best to determine the appropriate size of the campaign batches would have a big impact on the company's production costs, so he wanted to make sure that he knew what was going on before making the final proposal to the supply planning committee. Background1 As of 2016, F. Hoffmann-La Roche Ltd., based in Basel, Switzerland, was one of the five largest pharmaceutical corporations in the world, 2 with sales of more than 50 billion Swiss francs3 in 180 countries and more than 80,000 employees worldwide. The company was created in 1896 in Switzerland and, since then, had enjoyed more than a century of continued expansion, internationalization, and diversification. Popular products in its portfolio included Tamiflu, used to prevent and treat influenza, and MabThera, Avastin and Herceptin, leading oncology drugs. These shared its portfolio with less well-known products, such as the hepatitis drug Pegasys and the macular degeneration therapy Lucentis, some of which had 2015 annual sales of more than 1 billion francs each. Between 2000 and 2015, Roche divested some noncore operations, such as its vitamin and fine chemical businesses, to focus on two main segments: pharmaceuticals and diagnostics. The pharmaceutical business unit, which produced biologic and small-molecule products, provided 80% of sales, with oncology drugs making the largest sales contributions. In order to expand its pharmaceutical product offerings and fight against patent expirations and other increasing competitive pressures, the company conducted widespread research and development programs, and it had more than 100 drugs in the pipeline. The diagnostics division offered advanced DNA tests, diabetes monitoring supplies, and point-of-care diagnostics used in a variety of health-care settings. 4 In both pharmaceuticals and diagnostics, Roche focused on innovative products and personalized health care, targeting unmet medical needs and keeping the patient at the core of everything the company did. As with other leading companies in the industry, only a small percentage of Roche's enormous investment in R&D was converted into commercial products. Such investments had to be recouped with large gross margins and returns for its shareholders. (See Exhibits 1 and 2.) Production costs were high because of the rigorous quality-compliance requirements. In fact, a quality problem in production could lead to an investigation (which could temporarily stop production), to a recall of a marketed product, or to a patient stock-out. Given that the company depended on a small number of highly profitable products, such quality-assurance issues could affect productivity significantly. This was one of the main reasons why Roche owned its key production facilities, together with the need to be flexible in a rapidly changing industry, the advantage of having development facilities next to factories, and the use of unique technologies. Manufacturing a specific drug was a complex task. Two main available methods were available to obtain the drug substance: synthesis and biotechnology. The goal of synthesis was to convert simpler components into the desired drug through a series of chemical reactions, whereas biotechnology involved the use of living organisms to produce a specific drug, sometimes using advanced techniques such as gene splicing or recombinant DNA technology.5 The Pharmaceutical Production Process The production process required several well-differentiated stages and usually started several months or even years before the drug would arrive at the distribution centers. The production process could be split into three main stages. (See Exhibit 3.) During the first stage, the drug substance was created. This process was, by far, the most expensive and sophisticated. It typically consisted of multiple steps, was very capital-intensive, and needed to comply with strict quality specifications and environmental safety regulations. The ability to use the drug substance in subsequent production phases critically depended on the successful execution of this stage. The second stage took the active substance as a raw material and formulated it into the different dosage forms by adding the excipients-that is, the inactive substance of the tablet or the inactive liquid in which the active substance was suspended. The third and final stage consisted of customizing the drug according to the market requirements: presentation (such as bottles and pills), prospect language, size, etc. After this customization process, the number of stock keeping units (SKUs) increased dramatically from a few dozen to several hundred. Managing so many SKUs represented a major challenge, given the near-100% level of customer service required and the shelf-life constraints of the drugs, which was typically two or three years. A critical decision in the manufacturing process was deciding on the campaign or batch size for the first stage at each facility since the setup costs could be considerable. (The cost of a complete setup could be as high as 1 million Swiss francs in some cases.) This was mostly due to the fact that setups often implied the complete shutdown of production facilities for a period of days or weeks (which would imply an enormous opportunity cost), along with expensive cleaning and maintenance operations to ensure the noncontamination of the process for the next campaign. Because of this, campaigns were typically of a size that meant a specific drug substance would be produced once a year or even every other year. The drug substance was kept in stock under quality-compliance conditions so that shorter campaigns could be run later for the subsequent steps. The Improvement Program In the period between 2000 and 2015, the leading pharmaceutical companies were under increasing pressure to reduce costs to maintain their profitability. The reasons included: 1) the increasingly demanding government regulations to have a new drug approved, which increased the cost and time to introduce a new drug in the market, 2) governments' need to reduce health-care costs, 3) the pressure of the industry's "followers," who did not usually invest in R&D but waited for patents to expire so they could sell generics at a significantly lower price, and 4) the increasing pressure from the international community for pharmaceutical companies to reduce the cost of drugs in developing countries (e.g., HIV/AIDS treatments.) In late 2015, Roche launched a renewed improvement program to reduce the cost of its products at several levels of the organization, with a special focus on production. Production costs represented roughly 40% of the total cost. A key driver of cost in the production phase was the size of the production campaigns during the first stage of the production process. Decreasing the total amount of batches was desirable for many reasons, the most important being that smaller batches lead to a decrease in inventory and operating working capital (OWC) along with improved flexibility and customer service. However, the huge setup costs had prevented this batch reduction from occurring for many years. In 2016, the production managers at Roche considered that it was time to assess whether such infrequent changes still made sense. The Mainclas Team7 De Wit was assigned the task of finding out the appropriate approach to determine the products' campaign size. Two other people were allocated to his team: Pierre Martin, a senior manager from the finance department, and Andreu Torregrosa, a graduate of a prestigious supply-chain program in Southern Europe. De Wit's idea was to answer this question for a simple, relatively- easy-to-study product and then scale up the solution, once the value drivers had been identified. For the initial assessment, he picked Mainclas, a product with fairly stable demand and sales and a long-enough history of production costs. Current coverage for this product was 1.28 years Another characteristic that made Mainclas suitable for the initial assessment was that this product was manufactured in only one facility that had plenty of capacity, so the team did not have to worry about potential production bottlenecks or other capacity constraints. Exhibit 5 provides data about this product in more detail. During the kick-off meeting, after some discussion about the different alternatives, de Wit proposed that Martin and Torregrosa, each work individually to come up with an answer and they would all meet again a week later and compare results. Then they could decide the next steps. To avoid discrepancies, the team members decided to make some common assumptions, such as taxes being zero and the cost of capital being 12%, and using the selected data shown in Exhibit 5. Later on, they could refine these assumptions if necessary. Martin and Torregrosa, agreed and started working individually. The Consensus Meeting One week later, the three team members gathered again to share their answers. De Wit asked Martin, from the finance department, to go first. Martin explained: "As I see it, all our decisions in the company have to aim to increase value for the shareholders. Therefore, we should choose the campaign size that maximizes the value of the company for them. As is customary for us in the finance department, I performed an EVA9 analysis to calculate the optimal campaign size. Here are my numbers." (See Exhibit 8.) After Martin's detailed explanation, Torregrosa said: "Well, I took a different angle for solving the problem. From the historical data, I realized that the demand for Mainclas, is very stable and so the problem almost exactly replicates the EOQ model10 that I learned in inventory theory during my master's program. According to this model, the objective should be minimizing the cost of the process rather than maximizing the value for the firm, and I believe that is why the results I obtained are different from Pierre's."(See Exhibit 6.) At this point, de Wit was really surprised that the two approaches differed from his. "I have to admit that I expected differences in some of the results but not in the methods themselves," he said. "Let me explain what I did. Since changing the campaign size will impact the firm's cash flows, then making a decision on the batch size is equivalent to undertaking an investment. Therefore, I followed a standard NPV calculation 11 for investment valuation, estimating the expected incremental cash flows-which depend on the batch size chosen-and discounting . them at the company's cost of capital. And I am astonished to have found a third, different result." (See Exhibit 7.) Were the calculations in some of the reports incorrect? If the calculations were correct, then which approach was the right one? Were the other approaches inappropriate? If so, what assumptions invalidated those approaches? Alternatively, were some of the approaches just rough approximations? These questions came up one after the other in de Wit's head as he realized that an immediate answer was needed before the end of the following week, when the strategic production meeting for 2016 would take place Exhibit 3 Production Process for a Standard Drug 1. Drug substance production 2. Complex, sophisticated process Mix of dedicated facilities (biotechnology) and multipurpose facilities (chemical synthesis) using capital-intensive equipment Large production campaigns (1 to 2-year demand) Long manufacturing lead times (2 to 10 months) Long setup times (weeks) Drug product formulation Multipurpose facilities Average production campaigns (1 to 4-month demand) O Average manufacturing lead times (weeks) Average setup times (days) 3. Packaging Customization (country and market makeups) Equipment shared with other products Several company sites and even contractors perform these operations for the same products Short production campaigns (2 to 10 weeks, depending on market demand) Short manufacturing lead times (hours) Short setup times (hours) Exhibit 4 Brief Description of the EOQ Model, NPV Method, and EVA The Economic Order Quantity (EOQ) Model Consider a cost-minimizing firm that buys a single product at cost c, sells it at price p, faces a constant demand rate per period d, incurs an ordering cost K when an order is placed, and a cost h per dollar per period for holding inventory. This inventory holding cost typically includes expenses such as handling, obsolescence, and insurance, as well as a financial cost, which is a mix of interest expenses and the shareholders' opportunity cost (as a result of the fact that tying up resources in inventory prevents shareholders from investing their money somewhere else). . In this model's standard version, the firm minimizes the total cost over a period of time (say, a year) by choosing the appropriate order quantity, q. Formally, the problem can be formulated as min C(q) = Kd + 1 cq h 20 q2 where the first term is the cost of incurring setups during a period, and the second term is the cost of holding inventory during the same period. The solution can be shown to be The Cash-Flow Discounting or Net Present Value (NPV) Method Cash-flow discounting gives the value created for shareholders when an investment is made. Future cash flows are discounted at an appropriate rate (the cost of capital for shareholders,) which takes into account the time value of money. The discount rate is usually (although not necessarily) assumed to be constant and reflects the expected return of the best alternative that has roughly the same risk as the investment under consideration. Only incremental cash flows are relevant. The effect of taxes is usually considered, since the impact of taxes on the decision might be a major driver of value. Costs already incurred when the decision is to be made (i.e., sunk costs) should not be included in the calculations. A discrete discount is typically used, periods being natural or financial years. Changes in OWC are considered as cash flows (they actually are), even if these are not recognized as expenses in the income statement. Cash-|| flow discounting gives the net present value (NPV) of an investment. Formally, Exhibit 4 (Continued) Economic Value Added (EVA)12 Economic value added (EVA) is an expression that combines book and market values. Formally, EVA is defined as EVA = NOPAT - (Eb + Db WACC t tt-1-1 where NOPAT is the net operating profit after taxes, Eb and Db are respectively the values of equity and debt of the firm evaluated at book value, and WACC is the weighted average cost of capital of the firm. Note that EVA is not a cash flow but a mix of accounting and market parameters: NOPAT, E and D are given at book value, but WACC is computed at market value. Subscripts indicate the period at which each variable should be calculated. For instance, for t = 1, we can write the following expression: EVA1 = NOPAT1 - (E0b + DbQWACC, which shows that the value of EVA in one period (say one year) will be the NOPAT of the next exercise less the money invested in year 0 (today) multiplied by the cost of capital of the firm. To analyze the economic impact of a decision, the stream EVAT, t = 1,2, ... may be discounted at the WACC to obtain the so-called market value added (MVA), as follows: Roche: The Investment Decision Dilemma Exhibit 1 Group Consolidated Income Statement (in Milli 2015 2014 Sales 48,145 47,462 Royalties and other operating income 2,258 2,404 Cost of sales -15,460 -13,381 Marketing and distribution -8,814 -8,657 Research and development -9,581 -9,895 General and administration -2,727 -3,843 Operating profit 13,821 14,090 -1,574 -1,821 Financing costs Other financial income (expenses) -260 245 Profit before taxes 11,987 12,515 Income taxes -2,931 -2,980 Net income 9,056 9,535 ATLANTIC HOSPITAL SYSTEM CREATING VALUE IN SUPPLY CHAIN OPTIMIZATION The Atlantic Hospital System is a regional health service provider located in the central part of the United States. Business area covers Delaware, Maryland and Virginia AB M BC ON go WA NO MT NB WN PE SO WI ME NH NS OR ID MI WY NY LA MA NE IL NV MD UT United States KS IN OH KY W MO CA VA OK AR TN NC AZ NM MS SC AL TX GA UA FL Gulf of Mexico Mexico Cuba Puerto Rico Guatemala Caribbean Sea Map data 2018 Google, INEGI With a series of business purchases the system has reached 6 hospitals. Due to a number of public initiatives and the hospital's mission to provide quality service to whoever needs it,"management is thinking of changing their distribution system to achieve significant cost savings. They know that managing system assets is key to long-term success. Currently the system has 3 distribution centers located in theregion of operations and that manage the distribution of medical andsurgical supplies for the 6 hospitals. The supply chain VP has said that, "nothing is more important than having the resources available to our patients, nurses and doctors where needed." At the same time it is consenting that health-related costs have beenincreasing. This is why the supply chain group is nowevaluating alternatives in the design of its chain so that it can contribute to the mission and objectives of the system. Network Design Analysis Management has emphasized that high levels of service, high patient satisfaction and significant low costs. By keeping these objectives on the table, the department's analysts have considered adding an additional distribution center. This will improve service and customer satisfaction by having the supplies closest to hospitals. In addition, total supply chain costs would be reduced. This is the current system configuration. DE1 MD1 MD NE MD2 VA1 VAN VA2 VA SE VA3 DISTRIBUTION CENTER HOSPITAL Stage 1. Data collection To be able to carry out this analysis, it is necessary to have the current and future demand, the capacities of the distribution centers, the fixed and variable costs related to transportation, the operation of distribution centers and inventory. The following table presents weekly demand, supply capacities, and the number of units shipped between distribution centers and hospitals. SUPPLY DE1 MD1 MD2 VA1 VA2 VA3 SENT CAPACITY MDNE 1000 1250 3000 0 0 0 5250 5500 VAN 0 0 0 3000 0 0 3000 3000 VA SE 0 0 0 0 2000 1500 3500 4000 RECEIVED 1000 1250 3000 3000 2000 1500 DEMAND 1000 1250 3000 3000 2000 1500 This is the current system configuration. DE1 MD1 MD NE MD2 VA1 VAN VA2 VA SE VA3 DISTRIBUTION CENTER HOSPITAL Stage 1. Data collection To be able to carry out this analysis, it is necessary to have the current and future demand, the capacities of the distribution centers, the fixed and variable costs related to transportation, the operation of distribution centers and inventory. The following table presents weekly demand, supply capacities, and the number of units shipped between distribution centers and hospitals. SUPPLY DE1 MD1 MD2 VA1 VA2 VA3 SENT CAPACITY MDNE 1000 1250 3000 0 0 0 5250 5500 VAN 0 0 0 3000 0 0 3000 3000 VA SE 0 0 0 0 2000 1500 3500 4000 RECEIVED 1000 1250 3000 3000 2000 1500 DEMAND 1000 1250 3000 3000 2000 1500 Based on the weekly capacity of distribution centers and the demand rate of hospitals and the cost per unit to be transported between two points, the analysis shows that MDNE has a capacity of 5,500 units of which 5,250 are sent to DE1, MD1 and MD2 hospitals. The DE1 Hospital received all 1000 units it demanded from the MDNE distribution center. The following table shows the costs per unit of transportation, handling, and storage of medical supply inventory between any two points in the system. DE1 MD1 MD2 VA1 VA2 VA3 MDNE $ 3.7 $ 5.6 $ 8.6 $ 9.7 $ 12.5 $ 15.8 VAN $ 9.6 $ 8.9 $ 4.6 $ 2.2 $ 7.5 $ 8.4 VA SE $ 16.9 $ 18.2 $ 11.1 $ 7.3 $ 5.8 $ 2.5 WEEKLY $ $ 58,300.00 3,031,600.00 ANNUALLY The previous two tables also make it clear that they send 11,750 units per week and that the capacity is 12,500 for a utilization rate of 94%. The alternative The Atlantic system is looking at the possibility of adding a fourth distribution center in Southern Maryland (MDS). Based on the information in the following tables it was established that the total cost of this chain design is $46,150 weekly for an annual cost of $2,399,800. The center would cost $3,000,000 and a lifespan of 10 years. DE 1 MD NE MD 1 MD 2 MD S VAN VA 1 VA 2 VA SE VA 3 SUPPLY DE1 MD1 MD2 VA1 VA2 VA3 SENT CAPACITY MDNE 1000 1250 0 0 0 0 2250 5500 VAN 0 0 0 3000 0 0 3000 3000 VA SE 0 0 0 0 2000 1500 3500 4000 MDS 0 0 3000 0 0 0 3000 3000 RECEIVED 1000 1250 3000 3000 2000 1500 DEMAND 1000 1250 3000 3000 2000 1500 Exhibit #1 How to analyze the situation 1 2 3 4 5 6 7 8 9 10 Cost Savings Depreciaton Income Betore Taxes Income Taxes NOPAT Invested Capital WACC Capital Charge Economic Value Added Present Value $0.00 of EVA
Step by Step Solution
There are 3 Steps involved in it

Get step-by-step solutions from verified subject matter experts