Question: CASE BACKGROUND: We will continue with our StayVacay Case Study from past assignments. To recall the case: StayVacay is a (fictional) company that operates an
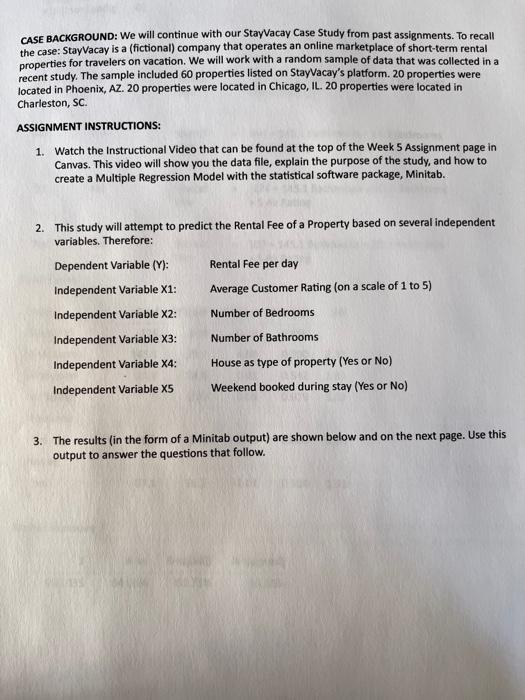
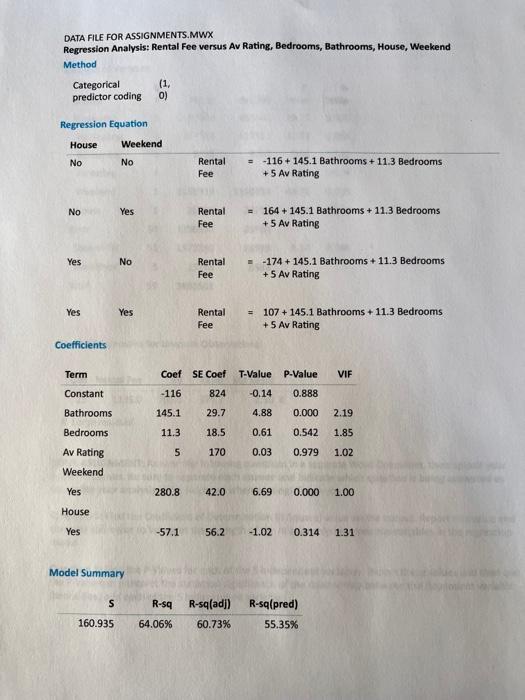
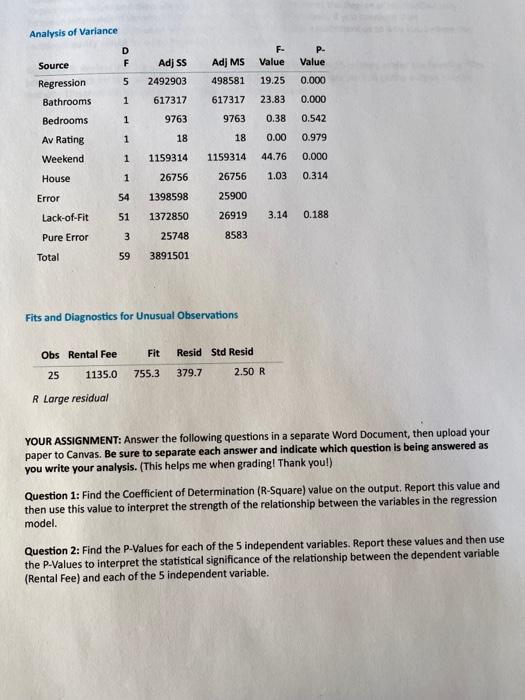
CASE BACKGROUND: We will continue with our StayVacay Case Study from past assignments. To recall the case: StayVacay is a (fictional) company that operates an online marketplace of short-term rental properties for travelers on vacation. We will work with a random sample of data that was collected in a recent study. The sample included 60 properties listed on StayVacay's platform. 20 properties were located in Phoenix, AZ. 20 properties were located in Chicago, IL. 20 properties were located in Charleston, SC. ASSIGNMENT INSTRUCTIONS: 1. Watch the Instructional Video that can be found at the top of the Week 5 Assignment page in Canvas. This video will show you the data file, explain the purpose of the study, and how to create a Multiple Regression Model with the statistical software package, Minitab. 2. This study will attempt to predict the Rental Fee of a Property based on several independent variables. Therefore: Dependent Variable (Y) : Rental Fee per day Independent Variable X1: Average Customer Rating (on a scale of 1 to 5 ) Independent Variable X2: Number of Bedrooms Independent Variable X3: Number of Bathrooms Independent Variable X4: House as type of property (Yes or No) Independent Variable X5 Weekend booked during stay (Yes or No) 3. The results (in the form of a Minitab output) are shown below and on the next page. Use this output to answer the questions that follow. DATA FILE FOR ASSIGNMENTS.MWX Regression Analysis: Rental Fee versus Av Rating, Bedrooms, Bathrooms, House, Weekend Method Categoricalpredictorcoding(1,0) Regression Equation Model Summary Analysis of Variance Fits and Diagnostics for Unusual Observations R Large residual YOUR ASSIGNMENT: Answer the following questions in a separate Word Document, then upload your paper to Canvas. Be sure to separate each answer and indicate which question is being answered as you write your analysis. (This helps me when grading! Thank you!) Question 1: Find the Coefficient of Determination (R-Square) value on the output. Report this value and then use this value to interpret the strength of the relationship between the variables in the regression model. Question 2: Find the P-Values for each of the 5 independent variables. Report these values and then use the P-Values to interpret the statistical significance of the relationship between the dependent variable (Rental Fee) and each of the 5 independent variable. Question 3: Find the Variance Inflation Factor (VIF) values for each of the 5 independent variables. Report these values and then use the values of each VIF to interpret the degree of multicollinearity between independent variables in the model. As part of this analysis, if you conclude that multicollinearity exists between independent variables, provide a statement as to why you believe the multicollinearity would be occurring with those variables. Question 4: Review the last portion of the output where Observation 25 is listed under the heading "Fits and Diagnostics for Unusual Observations". Then comment on what this portion of the output means and why Observation 25 was listed at the bottom of the output. CASE BACKGROUND: We will continue with our StayVacay Case Study from past assignments. To recall the case: StayVacay is a (fictional) company that operates an online marketplace of short-term rental properties for travelers on vacation. We will work with a random sample of data that was collected in a recent study. The sample included 60 properties listed on StayVacay's platform. 20 properties were located in Phoenix, AZ. 20 properties were located in Chicago, IL. 20 properties were located in Charleston, SC. ASSIGNMENT INSTRUCTIONS: 1. Watch the Instructional Video that can be found at the top of the Week 5 Assignment page in Canvas. This video will show you the data file, explain the purpose of the study, and how to create a Multiple Regression Model with the statistical software package, Minitab. 2. This study will attempt to predict the Rental Fee of a Property based on several independent variables. Therefore: Dependent Variable (Y) : Rental Fee per day Independent Variable X1: Average Customer Rating (on a scale of 1 to 5 ) Independent Variable X2: Number of Bedrooms Independent Variable X3: Number of Bathrooms Independent Variable X4: House as type of property (Yes or No) Independent Variable X5 Weekend booked during stay (Yes or No) 3. The results (in the form of a Minitab output) are shown below and on the next page. Use this output to answer the questions that follow. DATA FILE FOR ASSIGNMENTS.MWX Regression Analysis: Rental Fee versus Av Rating, Bedrooms, Bathrooms, House, Weekend Method Categoricalpredictorcoding(1,0) Regression Equation Model Summary Analysis of Variance Fits and Diagnostics for Unusual Observations R Large residual YOUR ASSIGNMENT: Answer the following questions in a separate Word Document, then upload your paper to Canvas. Be sure to separate each answer and indicate which question is being answered as you write your analysis. (This helps me when grading! Thank you!) Question 1: Find the Coefficient of Determination (R-Square) value on the output. Report this value and then use this value to interpret the strength of the relationship between the variables in the regression model. Question 2: Find the P-Values for each of the 5 independent variables. Report these values and then use the P-Values to interpret the statistical significance of the relationship between the dependent variable (Rental Fee) and each of the 5 independent variable. Question 3: Find the Variance Inflation Factor (VIF) values for each of the 5 independent variables. Report these values and then use the values of each VIF to interpret the degree of multicollinearity between independent variables in the model. As part of this analysis, if you conclude that multicollinearity exists between independent variables, provide a statement as to why you believe the multicollinearity would be occurring with those variables. Question 4: Review the last portion of the output where Observation 25 is listed under the heading "Fits and Diagnostics for Unusual Observations". Then comment on what this portion of the output means and why Observation 25 was listed at the bottom of the output