

Question: Case C.4 The Demand for Lamb A real-world demand function 140 130 120 Grams per person perweek 110 100 90 40 30 20 1974 1978
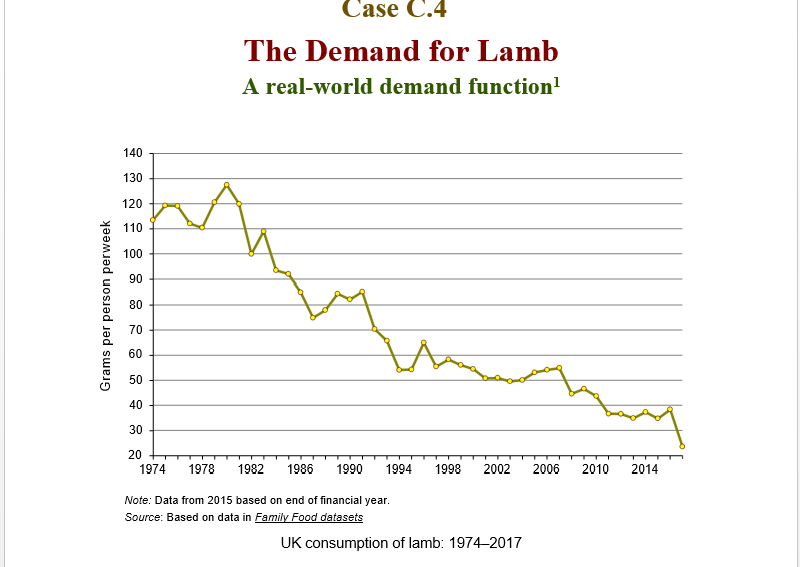
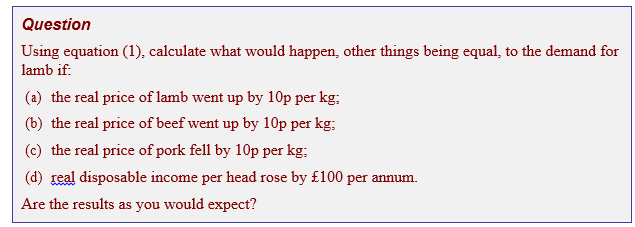
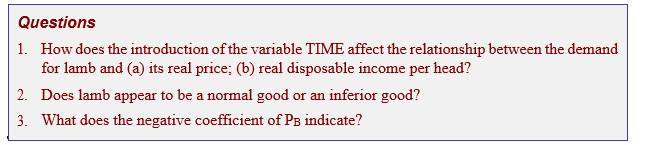
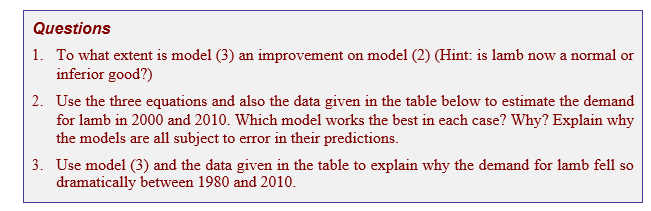
Case C.4 The Demand for Lamb A real-world demand function 140 130 120 Grams per person perweek 110 100 90 40 30 20 1974 1978 1982 1986 1990 1994 1998 2002 2006 2010 2014 Note: Data from 2015 based on end of financial year. Source: Based on data in Family Food datasets UK consumption of lamb: 1974-2017Question Using equation (1), calculate what would happen, other things being equal, to the demand for lamb if: (a) the real price of lamb went up by 10p per kg: (b) the real price of beef went up by 10p per kg; (c) the real price of pork fell by 10p per kg: (d) real disposable income per head rose by $100 per annum. Are the results as you would expect?Questions 1. How does the introduction of the variable TIME affect the relationship between the demand for lamb and (a) its real price; (b) real disposable income per head? 2. Does lamb appear to be a normal good or an inferior good? 3. What does the negative coefficient of PB indicate?Questions 1. To what extent is model (3) an improvement on model (2) (Hint: is lamb now a normal or inferior good?) 2. Use the three equations and also the data given in the table below to estimate the demand for lamb in 2000 and 2010. Which model works the best in each case? Why? Explain why the models are all subject to error in their predictions. 3. Use model (3) and the data given in the table to explain why the demand for lamb fell so dramatically between 1980 and 2010
Step by Step Solution
There are 3 Steps involved in it

Get step-by-step solutions from verified subject matter experts