

Question: Case Focus: This case illustrates that sales organization effectiveness must be evaluated in order to determine where problems are so that these problems can be
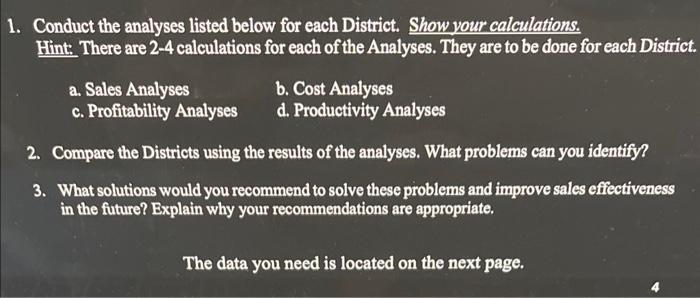
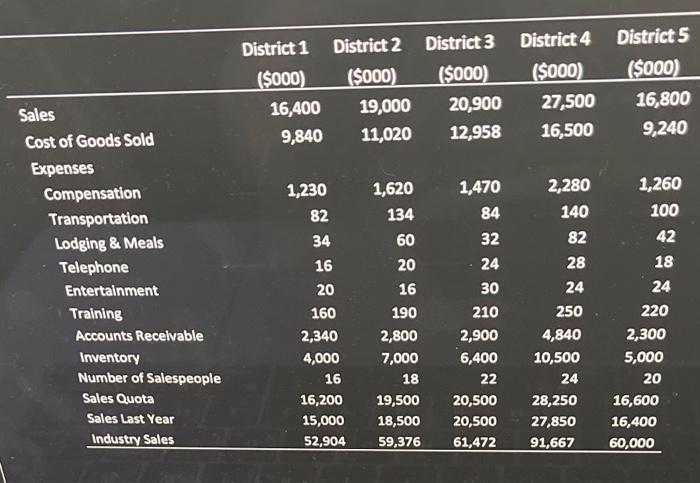
Case Focus: This case illustrates that sales organization effectiveness must be evaluated in order to determine where problems are so that these problems can be solved. The case presents an opportunity to conduct analyses for assessing sales organization effectiveness. Background Affiliated Merchandising markets a broad mix of household goods, toys and games to retailers throughout the United States. The salesforce is organized into five regions, each comprised of five districts. A national sales manager oversees the five regional sales managers. Each regional manager is responsible for the effectiveness of his or her region, including the districts comprising their region, and is compensated according to the achievements of their region. Current Situation Allison Wilson is the northem region sales manager for Affiliated Merchandising. The fiscal year just ended, and Allison has compiled data to help her analyze her region's effectiveness. Although her region has had what she believes to be a very successful year, she wants to analyze each district closely. She hopes to use her analysis to identify and correct problems. Moreover, she needs to complete her analysis for her upcoming meeting with her national sales manager, Bobbi Jones. Market shares for each district were fairly sizable (30 percent, 32 percent, 34 percent, 31 percent, and 28 percent for districts 1 through 5 , respectively) at the beginning of the fiscal year. Allison had expected these to remain relatively stable over the past year. The company had anticipated a sales growth of 2 percent. In addition, selling costs were budgeted at 10 percent of forecasted sales. If Allison's region did not increase sales by 2 percent and stay within the sales budget, her performance appraisal, and subsequently her compensation, would suffer. Allison knew her boss would carefully scrutinize her analysis. She hoped to be able to identify any problem areas so that she could develop solutions and implement them in the upcoming year. She was scheduled to meet with Jones in 3 days. Allison compiled the following information as shown in the table below. Questions 1. Conduct the analyses listed below for each District. Show your calculations 1. Conduct the analyses listed below for each District. Show your calculations. Hint: There are 2-4 calculations for each of the Analyses. They are to be done for each District. a. Sales Analyses b. Cost Analyses c. Profitability Analyses d. Productivity Analyses 2. Compare the Districts using the results of the analyses. What problems can you identify? 3. What solutions would you recommend to solve these problems and improve sales effectiveness in the future? Explain why your recommendations are appropriate. The data you need is located on the next page. \begin{tabular}{lrrrrrrr} & District 1 & District 2 & District 3 & District 4 & District 5 \\ & ($000) & ($000) & ($000) & ($000) & (5000) \\ \hline Sales & 16,400 & 19,000 & 20,900 & 27,500 & 16,800 \\ Cost of Goods Sold & 9,840 & 11,020 & 12,958 & 16,500 & 9,240 \\ Expenses & & & & & & & \\ Compensation & 1,230 & 1,620 & 1,470 & 2,280 & 1,260 \\ Transportation & 82 & 134 & 84 & 140 & 100 \\ Lodging \& Meals & 34 & 60 & 32 & 82 & 42 \\ Telephone & 16 & 20 & 24 & 28 & 18 \\ Entertainment & 20 & 16 & 30 & 24 & 24 \\ Training & 160 & 190 & 210 & 250 & 220 \\ Accounts Recelvable & 2,340 & 2,800 & 2,900 & 4,840 & 2,300 \\ Inventory & 4,000 & 7,000 & 6,400 & 10,500 & 5,000 \\ Number of Salespeople & 16 & 18 & 22 & 24 & 20 \\ Sales Quota & 16,200 & 19,500 & 20,500 & 28,250 & 16,600 \\ Sales Last Year & 15,000 & 18,500 & 20,500 & 27,850 & 16,400 \\ Industry Sales & 52,904 & 59,376 & 61,472 & 91,667 & 60,000 \\ \hline \end{tabular}
Step by Step Solution
There are 3 Steps involved in it

Get step-by-step solutions from verified subject matter experts