

Question: Case: GW Regional Airlines: Solving Operational Problems with Quality Control Tools Introduction GW Air operates as an independent airline, unaffiliated with national carriers. The airline
Case: GW Regional Airlines: Solving Operational Problems with Quality Control Tools
Introduction GW Air operates as an independent airline, unaffiliated with national carriers. The airline is located in the small city of Concord, New Hampshire, and runs regularly scheduled domestic flights with routes to Boston, Nantucket, Hyannis, New Bedford, and Marthas Vineyard, Massachusetts, and Providence, Rhode Island. Although part of the business includes some mail and freight, business and leisure travelers make up most of the companys revenues. GW Air carries over 50,000 passengers a year and operates a fleet of 23 Cessna 402s. The Cessna 402s have proven themselves over the years, although the fleet is aging and has been plagued with maintenance issues that have led to delays. The planes were manufactured for a small airline offering corporate transport and were produced between 1966 and 1985. At GW Air they are designed with nine passenger seats for commuter usage, and have a cruising speed of 163 mph and a range of 1,400 miles. For the airline these are workhorse planes that are inexpensive to purchase and operate. With up to 50 flights a day during the summer season, there are no plans to change or upgrade the current fleet of Cessna 402s, staffing levels, gate technology, or baggage equipment, beyond normal replacement or equipment failure. Ground Operations Successful ground operations require processes to run smoothly. A single problem can trigger a cascade of effects, including the delay or late arrival of a flight. Ground operations generally include the following: Ticketing and gate agents; Fueling; Passenger baggage handling; Freight and mail loading; Clearing aircraft; Aircraft maintenance; Cabin cleaners; and Tug operations. Although new technology has not exactly been embraced at GW Air, the company has been able to reduce its workforce over the years due to the creation of efficiencies. However, ontime arrivals and delay issues appear to be related to airplane maintenance, baggage handling, ticketing, cleaning the aircraft, and other ground transportation activities. In addition, some frequent GW Air travelers have grown accustomed to these delays and have expressed concerns that they are now normal. Improving Operations at GW Air Organizationally, GW Airs productivity and quality of service have been in question, impacting the organizations energy, performance, and strategy execution. Although employees are generally happy with the organization, they are continually asked to work faster, harder, and better while providing higher quality service to the flying public. Since 1990, there has been no growth in the GW Air fleet. As a result, load factor percentage has steadily increased from 82% in 1990 to 96% in 2021. Load factors in the airline industry are used as a gauge of productivity and utilization of aircraft and simply explain how full the aircraft are. The graph shown in Figure 1 illustrates this relationship.
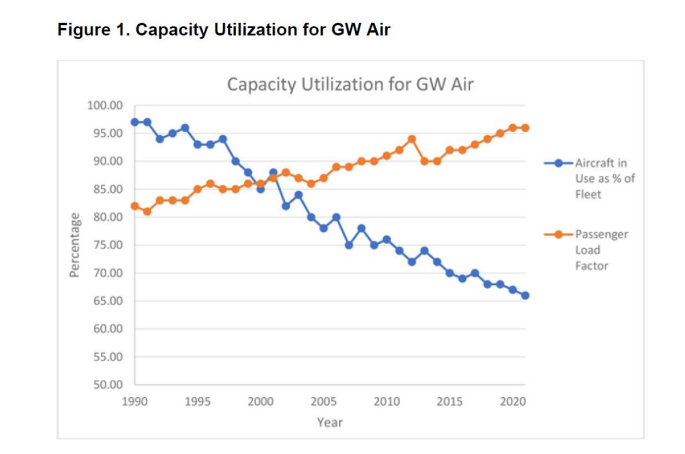
In addition, aircraft in use as a percentage of fleet has declined from a 1990 high of 97% to a 2021 low of 66%. This measure identifies how many hours per day aircraft are utilized as a percentage of fleet flying. If planes are being repaired or stored, it brings down the aircraft in use as a percentage of the fleet. As the graph in Figure 1 illustrates, since 1990, even though the number of aircraft in the fleet has stayed the same, their utilization has declined as they have needed to be repaired, modernized, or stored. At the same time, the planes flying are loaded to a higher capacity to meet demand and satisfy the passengers. The aging fleet and high passenger load factor have placed stress on the operating fleet as well as the workforce to meet customer expectations.
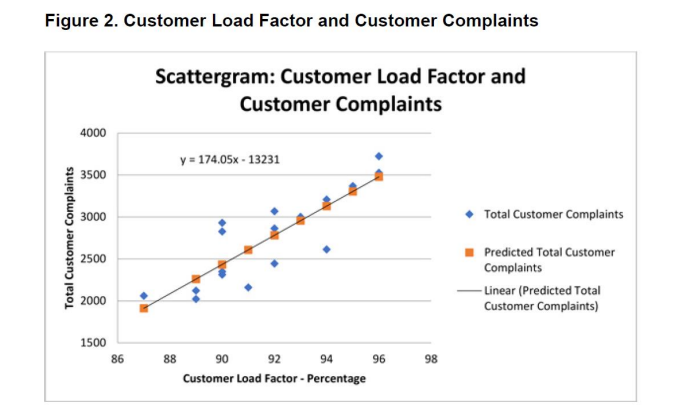
Customer Satisfaction at GW Air As customer load factors have increased, customer complaints have also increased. The scattergram shown in Figure 2 illustrates the relationship between the customer load factor percentage and the number of customer complaints at GW Air. There appears to be a close relationship between how full the aircraft is and perceptions of quality service.
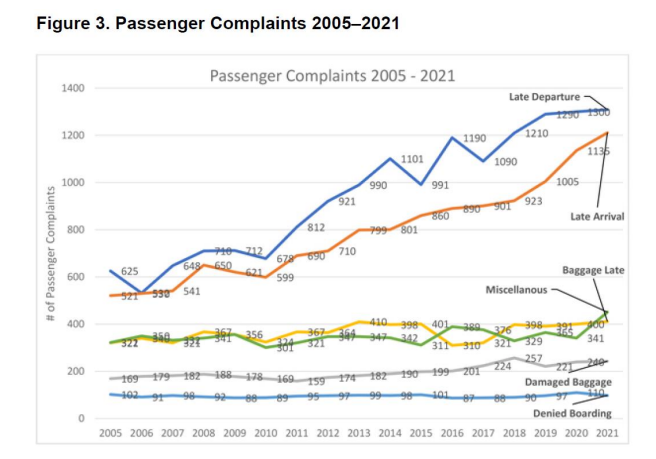
In addition, given that frequent flyers have taken advantage of GW Air service for decades, staff have gone out of their way to protect these customers by holding up departures and extending baggage deadlines. Looking at passenger complaints at a more granular level, as shown in the line chart in Figure 3, we see that customer concerns are not only associated with comfortable space on the planes, 6 MGMT 601 Case Analysis but also regarding late departures, late arrivals, late bags, damaged baggage, denied boarding, and other miscellaneous criticisms. However, as illustrated in Figure 3, late bags, damaged baggage, and denied boarding have remained relatively flat since 2005, while late departures and arrivals have more than doubled during the same period.
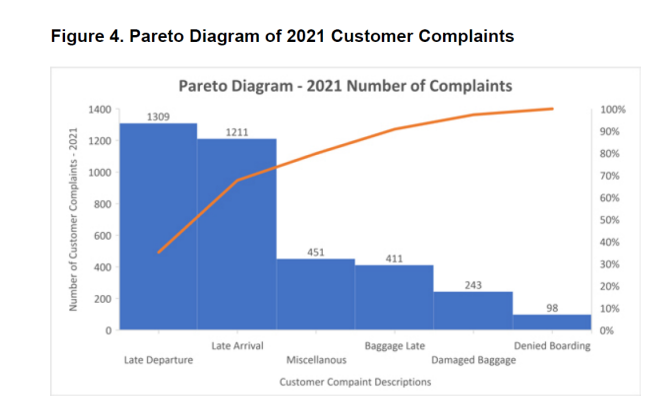
The Pareto diagram, shown in Figure 4, illustrates the type of customer complaint in order of frequency. The Pareto chart is a type of quality chart that indicates the frequency of defects as well as establishing a cumulative line or impact. As illustrated in this diagram, the cumulative line is steep, resulting from late departures and arrivals; however, it levels off over time. This leveling off may lead to less emphasis on items such as late baggage, damaged baggage, or denied boarding complaints. 7 MGMT 601 Case Analysis In addition, the Pareto Principles advise that 80% of the problems result from 20% of the causes. Therefore, finding the 20% of defect types (late departure and late arrival) is key to what problems are causing 80% of the complaints
On-Time Plane Departures Problems with on-time departures often cascade into other areas of operations, including flight tarmac times, mishandled baggage, mishandled wheelchairs/scooters, and denied boardings. As an industry standard, the average delay on departing flights is 12.4 minutes. This 12.4- minute delay is calculated based on a 15-minute grace period associated with the standard. Therefore, according to the standard, if a plane is delayed 10 minutes, the actual delay from the customers perspective is 25 minutes
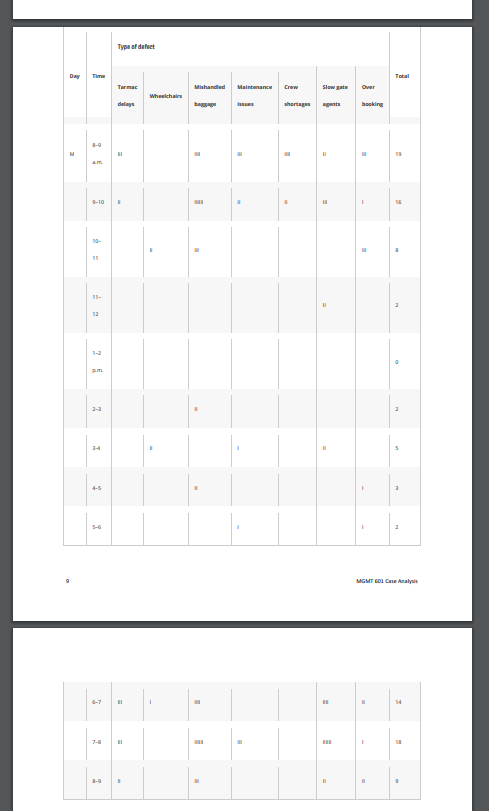
To better understand on-time departures, the following quality management check sheet (see Table 1) is used for problem identification. In this case it is used to evaluate the reasons for problems associated with on-time departures. These check sheets allow GW Air to record and organize data to facilitate effective collection. This makes it easier to understand where defects are occurring and at what time during the day. As illustrated in Table 1, some problems in ontime departures are occurring in the operations associated with baggage and at the gate before the passengers board. In addition, problems seem to be occurring between 8 and 10 a.m. and in the evenings between 6 and 9 p.m.
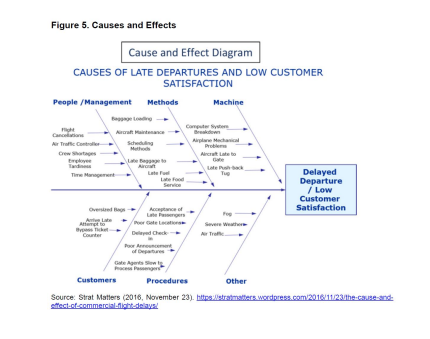
To begin to understand the root causes of the problems regarding on-time departures at GW Air, a brainstorming activity was organized with top operations leaders at the company. The outcome of this brainstorming activity was the cause-and-effect diagram shown in Figure 5, often referred to as a fishbone or Ishikawa diagram. This helped the team members not only to identify the various problems associated with on-time departures, but also the categories of these factors. Categories associated with on-time departures include people/management, methods, machine, customers, procedures, and other issues. Some of these problems/defects are more likely to cause complications with on-time departures than others; however, the diagram provides opportunities for a deeper analysis. This will allow the team to begin asking who, what, where, when, why, and how questions to develop a better understanding for problem-solving
This case showcases the importance of leadership in any organization by depicting that leadership is one the strategic keys for the success of organizations. GW Airlines is at a turning point to improve operations or have the organization fail. The leadership team is seeking to address these challenges by looking for ways to enhance organizational efficiency while improving the level of customer service
Problem Identification The organization is facing multiple issues. You have been hired as Human Resource Consultants to analyze the issues and provide recommendations to the CEO and Senior Management at GW Airlines.
QUESTION
Providing a professional assessment of the situation (e.g., reviewing external/internal environmental factors, providing situational analysis, etc.) as if you were an invited management consultant
Figure 1. Capacity Utilization for GW Air Figure 2. Customer Load Factor and Customer Complaints Figure 3. Passenger Complaints 2005-2021 Figure 4. Pareto Diagram of 2021 Customer Complaints Figure 5. Causes and Effects ander
Step by Step Solution
There are 3 Steps involved in it

Get step-by-step solutions from verified subject matter experts