

Question: CASE NOTES: This spreadsheet contains data for the number of patients obtaining an MRI ( Magnetic Resonance Imaging ) scan at a small local hospital.
CASE NOTES:
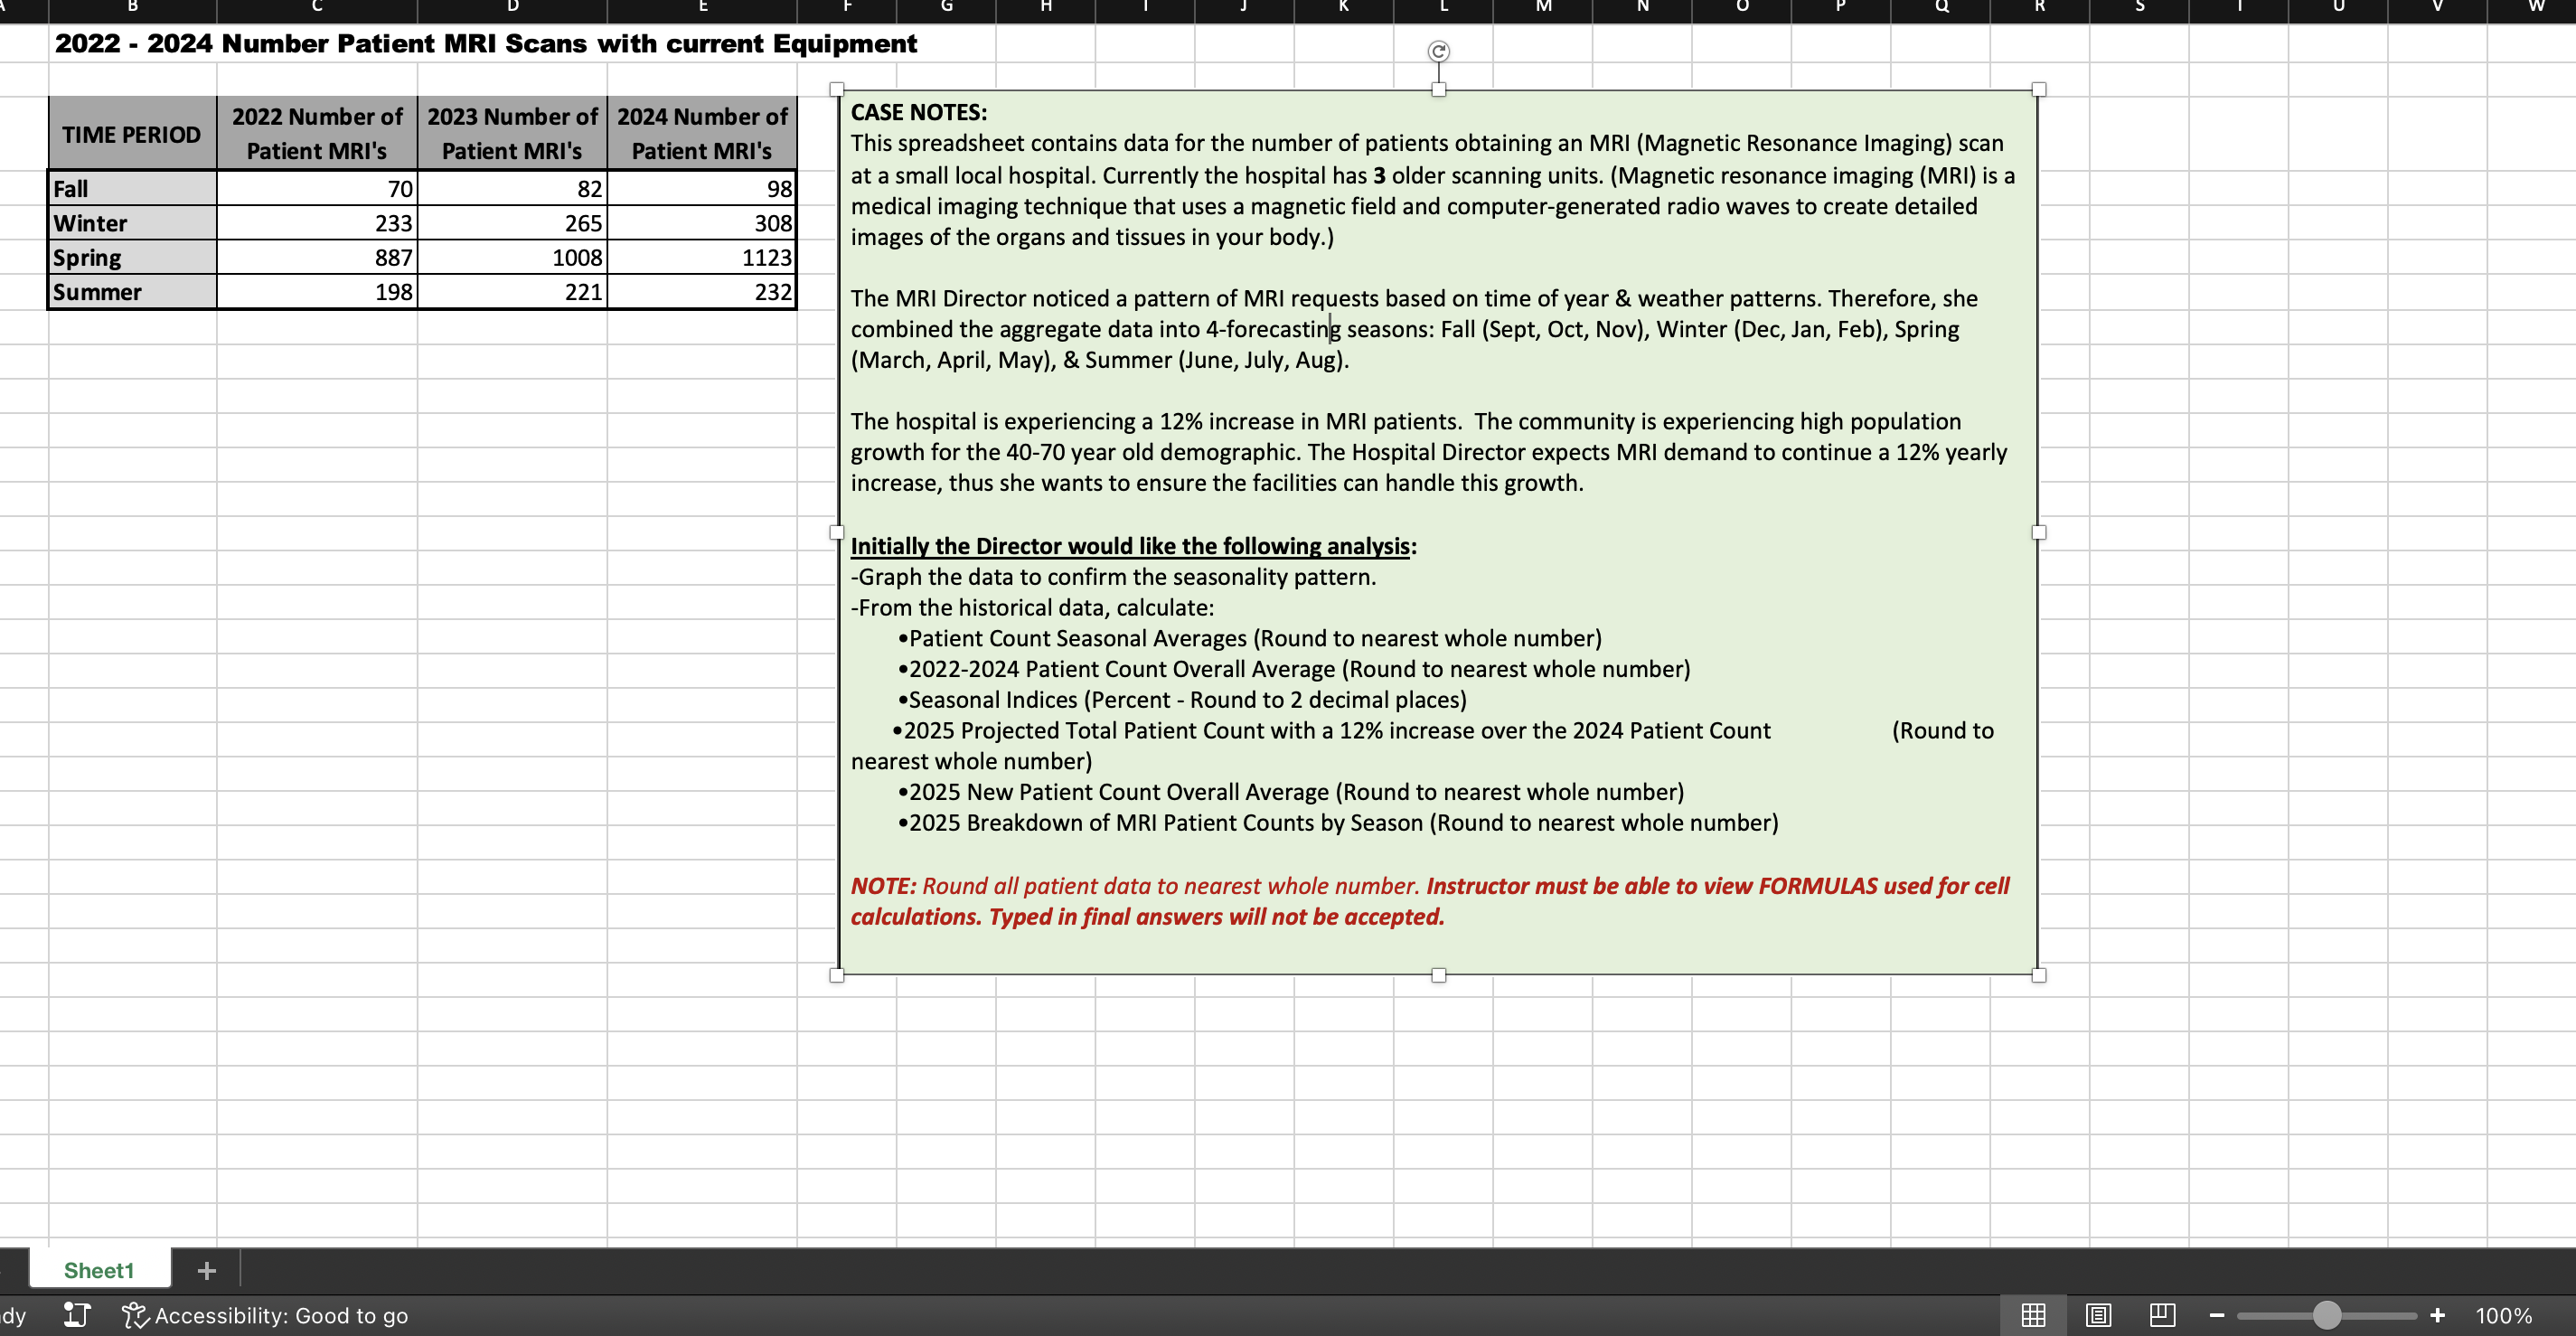
This spreadsheet contains data for the number of patients obtaining an MRI Magnetic Resonance Imaging scan at a small local hospital. Currently the hospital has older scanning units. Magnetic resonance imaging MRI is a medical imaging technique that uses a magnetic field and computergenerated radio waves to create detailed images of the organs and tissues in your body.
The MRI Director noticed a pattern of MRI requests based on time of year & weather patterns. Therefore, she combined the aggregate data into forecasting seasons: Fall Sept Oct, Nov Winter Dec Jan, Feb Spring March April, May& Summer June July, Aug
The hospital is experiencing a increase in MRI patients. The community is experiencing high population growth for the year old demographic. The Hospital Director expects MRI demand to continue a yearly increase, thus she wants to ensure the facilities can handle this growth.
Initially the Director would like the following analysis:
Graph the data to confirm the seasonality pattern.
From the historical data, calculate:
Patient Count Seasonal Averages Round to nearest whole number
Patient Count Overall Average Round to nearest whole number
Seasonal Indices Percent Round to decimal places
Projected Total Patient Count with a increase over the Patient Count nearest whole number
New Patient Count Overall Average Round to nearest whole number
Breakdown of MRI Patient Counts by Season Round to nearest whole number
NOTE: Round all patient data to nearest whole number. Instructor must be able to view FORMULAS used for cell calculations. Typed in final answers will not be accepted.
Step by Step Solution
There are 3 Steps involved in it
1 Expert Approved Answer
Step: 1 Unlock

Question Has Been Solved by an Expert!
Get step-by-step solutions from verified subject matter experts
Step: 2 Unlock
Step: 3 Unlock