

Question: Case Problem 9.1 Brett Runs Some Technical Measures on a Stock G5 Brett Daly is an active stock trader and an avid market technician. He
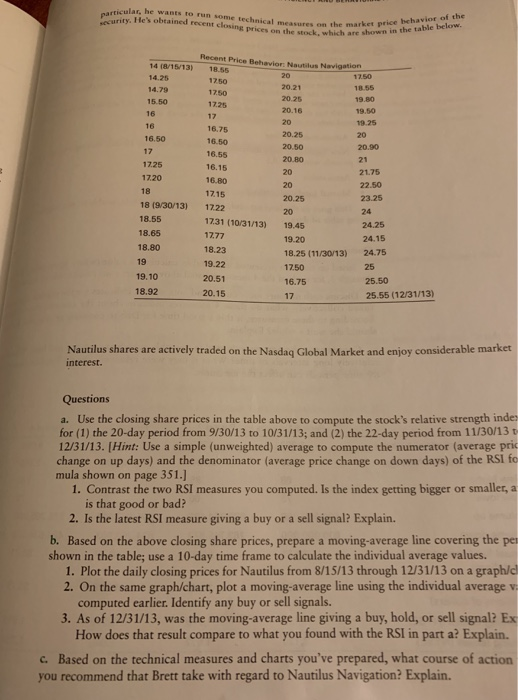
Case Problem 9.1 Brett Runs Some Technical Measures on a Stock G5 Brett Daly is an active stock trader and an avid market technician. He got into technical ana of his anal ahout 10 years ago, and although he now uses the Internet for much still enjoys running some of the numbers and doing some of the charting himse describe himself as a serious stock trader who relies on technical analysis for nor all-of the information he uses to make an investment decision; unlike some certain cians, he does not totally ignore a stock's fundamentals. Right now he's got his e that he's been tracking for the past 3 or 4 months. ytical work work, he likes to e of the charting himself. Bre sis for some-but certainly market techni eye on a stock The stock is Nautilus Navigation, a mid-sized high-tech company that's been arou number of years and has a demonstrated ability to generate profits year-in and vea problem is that the carnings are a bit erratic, tending to bounce up and down fror which causes the price of the stock to be a bit erratic as well. And that's exactly why Brett iks the stock-as a trader, the volatile prices enable him to move in and out of the stock over rela tively short (3- to 6-month) periods of time. r-out. Brett has already determined that the stock has "decent" fundament worry about its basic soundness. He s, so he does not n concentrate on the technical side of the stock. I lar, he wants to run some t acurity. He's obtained recent elosing prices on the stock, which are the market price behavior of the shown in the table below. echnical measures on Recent Price Behavior: Nautilus Nevigation 14 (8/15/13) 18.55 14.25 14.79 15.50 16 1750 17.25 17 16.75 16.50 16.55 16.15 16.80 17.15 20.25 20.16 19.50 19.25 16 20.25 20.50 20.80 20 16.50 20.90 17.25 1720 21.75 22.50 20.25 18 (9/30/13) 1722 8.55 18.65 18.80 19 19.10 18.92 24 24.25 24.15 1731 (10/31/13) 19.45 18.23 19.22 20.51 20.15 19.20 18.25 (11/30/13) 24.75 17.50 16.75 17 25.50 25.55 (12/31/13) Nautilus shares are actively traded on the Nasdaq Global Market and enjoy considerable market interest. Questions a. Use the closing share prices in the table above to compute the stock's relative strength inde: for (1) the 20-day period from 9/30/13 to 10/31/13; and (2) the 22-day period from 11/30/13 t 12/31/13. [Hint: Use a simple (unweighted) average to compute the numerator (average pric change on up days) and the denominator (average price change on down days) of the RSI fo mula shown on page 351.] 1. Contrast the two RSI measures you computed. Is the index getting bigger or smaller, a is that good or bad? 2. Is the latest RSI measure giving a buy or a sell signal? Explain. b. Based on the above closing share prices, prepare a moving-average line covering the pe shown in the table; use a 10-day time frame to calculate the individual average values. 1. Plot the daily closing prices for Nautilus from 8/15/13 through 12/31/13 on a graph/d 2. On the same graph/chart, plot a moving-average line using the individual average v computed earlier. Identify any buy or sell signals. 3. As of 12/31/13, was the moving-average line giving a buy, hold, or sell signal? Ex How does that result compare to what you found with the RSI in part a? Explain. what course of action c. Based on the technical measures and charts you've prepared, you recommend that Brett take with regard to Nautilus Navigation? Explain. Case Problem 9.1 Brett Runs Some Technical Measures on a Stock G5 Brett Daly is an active stock trader and an avid market technician. He got into technical ana of his anal ahout 10 years ago, and although he now uses the Internet for much still enjoys running some of the numbers and doing some of the charting himse describe himself as a serious stock trader who relies on technical analysis for nor all-of the information he uses to make an investment decision; unlike some certain cians, he does not totally ignore a stock's fundamentals. Right now he's got his e that he's been tracking for the past 3 or 4 months. ytical work work, he likes to e of the charting himself. Bre sis for some-but certainly market techni eye on a stock The stock is Nautilus Navigation, a mid-sized high-tech company that's been arou number of years and has a demonstrated ability to generate profits year-in and vea problem is that the carnings are a bit erratic, tending to bounce up and down fror which causes the price of the stock to be a bit erratic as well. And that's exactly why Brett iks the stock-as a trader, the volatile prices enable him to move in and out of the stock over rela tively short (3- to 6-month) periods of time. r-out. Brett has already determined that the stock has "decent" fundament worry about its basic soundness. He s, so he does not n concentrate on the technical side of the stock. I lar, he wants to run some t acurity. He's obtained recent elosing prices on the stock, which are the market price behavior of the shown in the table below. echnical measures on Recent Price Behavior: Nautilus Nevigation 14 (8/15/13) 18.55 14.25 14.79 15.50 16 1750 17.25 17 16.75 16.50 16.55 16.15 16.80 17.15 20.25 20.16 19.50 19.25 16 20.25 20.50 20.80 20 16.50 20.90 17.25 1720 21.75 22.50 20.25 18 (9/30/13) 1722 8.55 18.65 18.80 19 19.10 18.92 24 24.25 24.15 1731 (10/31/13) 19.45 18.23 19.22 20.51 20.15 19.20 18.25 (11/30/13) 24.75 17.50 16.75 17 25.50 25.55 (12/31/13) Nautilus shares are actively traded on the Nasdaq Global Market and enjoy considerable market interest. Questions a. Use the closing share prices in the table above to compute the stock's relative strength inde: for (1) the 20-day period from 9/30/13 to 10/31/13; and (2) the 22-day period from 11/30/13 t 12/31/13. [Hint: Use a simple (unweighted) average to compute the numerator (average pric change on up days) and the denominator (average price change on down days) of the RSI fo mula shown on page 351.] 1. Contrast the two RSI measures you computed. Is the index getting bigger or smaller, a is that good or bad? 2. Is the latest RSI measure giving a buy or a sell signal? Explain. b. Based on the above closing share prices, prepare a moving-average line covering the pe shown in the table; use a 10-day time frame to calculate the individual average values. 1. Plot the daily closing prices for Nautilus from 8/15/13 through 12/31/13 on a graph/d 2. On the same graph/chart, plot a moving-average line using the individual average v computed earlier. Identify any buy or sell signals. 3. As of 12/31/13, was the moving-average line giving a buy, hold, or sell signal? Ex How does that result compare to what you found with the RSI in part a? Explain. what course of action c. Based on the technical measures and charts you've prepared, you recommend that Brett take with regard to Nautilus Navigation? Explain
Step by Step Solution
There are 3 Steps involved in it

Get step-by-step solutions from verified subject matter experts