Case Question-1: Apparently, among the three proposed aggregate plans, the chase strategy in which all production occurs in Chile has the lowest cost for Green Mills. Develop a Chase strategy in which all production occurs in the US and compare how much the company is better-off by making all production in Chile. (zoom in to see chart data)
Apparently US constraints can be found within. I can't figure out how.
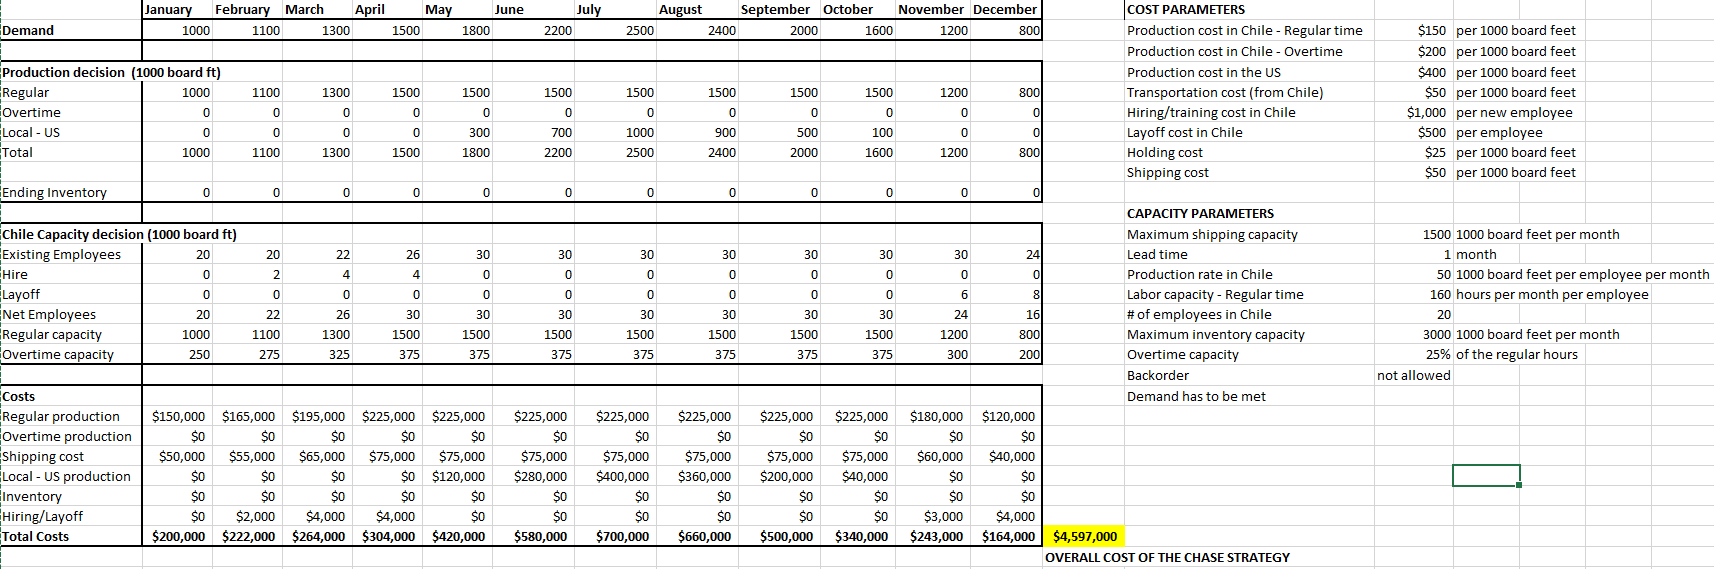
April January February March 1000 1100 1300 May 1500 June 1800 July 2200 August September October November December 2500 2400 2000 1600 1200 800 Demand 1500 1500 Production decision (1000 board ft) Regular 1000 Overtime 0 Local - US Total 1000 1100 0 0 1100 1300 0 0 1300 0 1500 0 0 1500 1500 0 300 1800 1500 0 900 2400 COST PARAMETERS Production cost in Chile - Regular time Production cost in Chile - Overtime Production cost in the US Transportation cost (from Chile) Hiring/training cost in Chile Layoff cost in Chile Holding cost Shipping cost 1500 0 500 2000 $150 per 1000 board feet $200 per 1000 board feet $400 per 1000 board feet $50 per 1000 board feet $1,000 per new employee $500 per employee $25 per 1000 board feet $50 per 1000 board feet 1500 1200 0 0 1000 1600 1200 700 2200 0 1000 2500 800 Ending Inventory 0 0 0 0 0 0 0 0 0 0 2 Chile Capacity decision (1000 board ft) Existing Employees Hire Layoff Net Employees - 20 Regular capacity 1000 Overtime capacity 250 0 0 0 0 30 1500 375 0 26 1300 325 30 CAPACITY PARAMETERS Maximum shipping capacity Lead time Production rate in Chile Labor capacity - Regular time # of employees in Chile Maximum inventory capacity Overtime capacity Backorder Demand has to be met 0 30 1500 375 22 1100 275 24 1500 1000 board feet per month 1 month 50 1000 board feet per employee per month 160 hours per month per employee 20 3000 1000 board feet per month 25% of the regular hours not allowed 0 30 1500 375 30 1500 375 1500 1500 375 30 1500 375 1200 300 800 375 $225,000 $225,000 $225,000 $180,000 $120,000 $0 $0 $0 Costs Regular production Overtime production Shipping cost Local - US production Inventory Hiring/Layoff Total Costs $150,000 $0 $50,000 $0 $0 $165,000 $0 $55,000 $0 $0 $2,000 $222,000 $195,000 $0 $65,000 $0 $40,000 $225,000 $0 $75,000 $200,000 $225,000 $0 $75,000 $280,000 $0 $0 $580,000 $225,000 $0 $75,000 $40,000 $75,000 $120,000 $225,000 $0 $75,000 $360,000 $0 $75,000 $400,000 $75,000 $0 $0 $4,000 $304,000 SO $0 SO So SO $60,000 $0 $0 $3,000 $243,000 $0 $o $4,000 $264,000 $0 $340,000 $0 $4,000 $164,000 $200,000 $420,000 $700,000 $660,000 $500,000 $4,597,000 OVERALL COST OF THE CHASE STRATEGY April January February March 1000 1100 1300 May 1500 June 1800 July 2200 August September October November December 2500 2400 2000 1600 1200 800 Demand 1500 1500 Production decision (1000 board ft) Regular 1000 Overtime 0 Local - US Total 1000 1100 0 0 1100 1300 0 0 1300 0 1500 0 0 1500 1500 0 300 1800 1500 0 900 2400 COST PARAMETERS Production cost in Chile - Regular time Production cost in Chile - Overtime Production cost in the US Transportation cost (from Chile) Hiring/training cost in Chile Layoff cost in Chile Holding cost Shipping cost 1500 0 500 2000 $150 per 1000 board feet $200 per 1000 board feet $400 per 1000 board feet $50 per 1000 board feet $1,000 per new employee $500 per employee $25 per 1000 board feet $50 per 1000 board feet 1500 1200 0 0 1000 1600 1200 700 2200 0 1000 2500 800 Ending Inventory 0 0 0 0 0 0 0 0 0 0 2 Chile Capacity decision (1000 board ft) Existing Employees Hire Layoff Net Employees - 20 Regular capacity 1000 Overtime capacity 250 0 0 0 0 30 1500 375 0 26 1300 325 30 CAPACITY PARAMETERS Maximum shipping capacity Lead time Production rate in Chile Labor capacity - Regular time # of employees in Chile Maximum inventory capacity Overtime capacity Backorder Demand has to be met 0 30 1500 375 22 1100 275 24 1500 1000 board feet per month 1 month 50 1000 board feet per employee per month 160 hours per month per employee 20 3000 1000 board feet per month 25% of the regular hours not allowed 0 30 1500 375 30 1500 375 1500 1500 375 30 1500 375 1200 300 800 375 $225,000 $225,000 $225,000 $180,000 $120,000 $0 $0 $0 Costs Regular production Overtime production Shipping cost Local - US production Inventory Hiring/Layoff Total Costs $150,000 $0 $50,000 $0 $0 $165,000 $0 $55,000 $0 $0 $2,000 $222,000 $195,000 $0 $65,000 $0 $40,000 $225,000 $0 $75,000 $200,000 $225,000 $0 $75,000 $280,000 $0 $0 $580,000 $225,000 $0 $75,000 $40,000 $75,000 $120,000 $225,000 $0 $75,000 $360,000 $0 $75,000 $400,000 $75,000 $0 $0 $4,000 $304,000 SO $0 SO So SO $60,000 $0 $0 $3,000 $243,000 $0 $o $4,000 $264,000 $0 $340,000 $0 $4,000 $164,000 $200,000 $420,000 $700,000 $660,000 $500,000 $4,597,000 OVERALL COST OF THE CHASE STRATEGY


