

Question: Case Study 1: The AusCandy Demand (10 marks) The following table shows the historical demand data for product A in AusCandy Co. Answer the
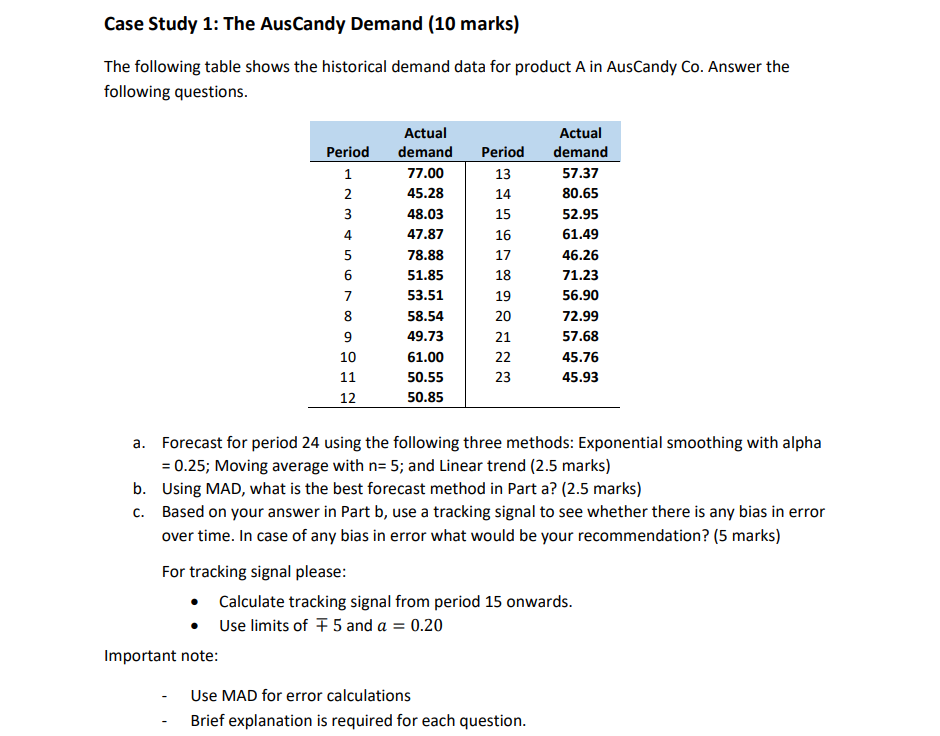
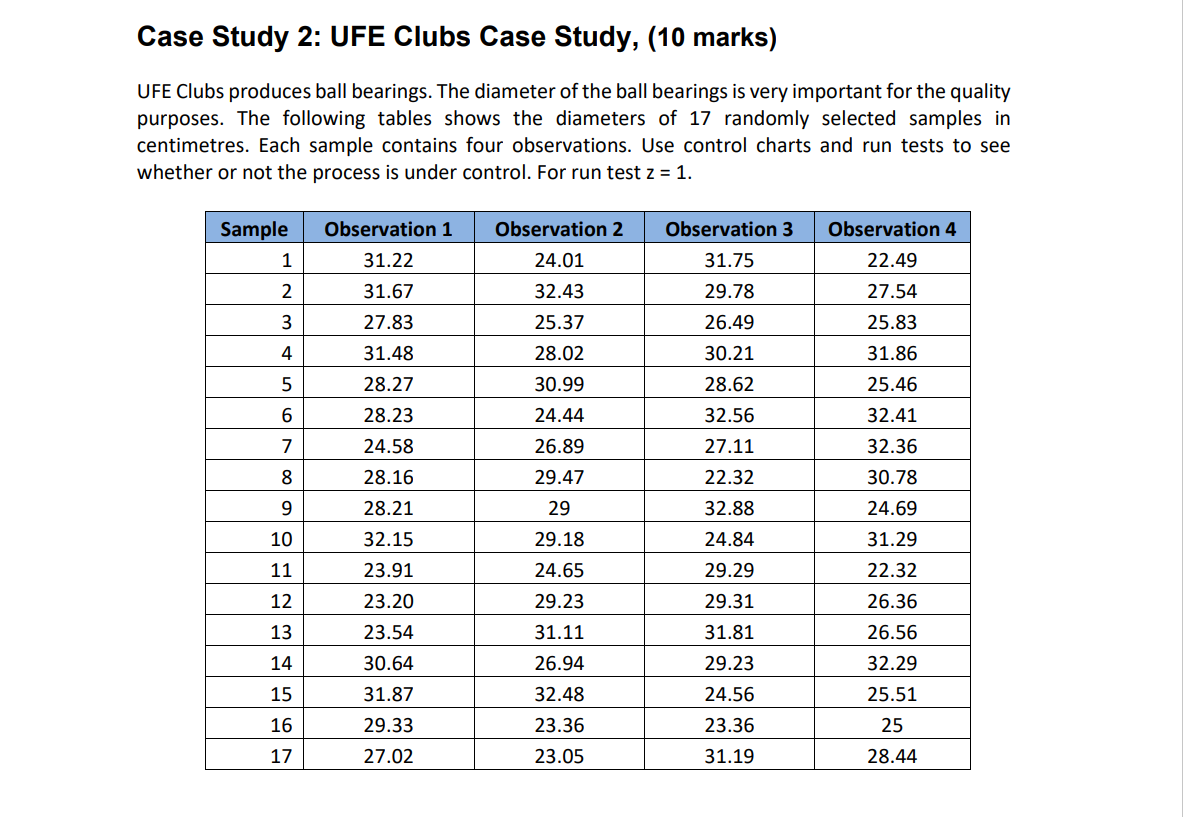
Case Study 1: The AusCandy Demand (10 marks) The following table shows the historical demand data for product A in AusCandy Co. Answer the following questions. Actual Actual Period demand Period demand 123 1 77.00 13 57.37 2 45.28 14 80.65 3 48.03 15 52.95 4 47.87 16 61.49 5 78.88 17 46.26 6 51.85 18 71.23 53.51 19 56.90 8 58.54 20 72.99 9 49.73 21 57.68 10 61.00 11 50.55 22 22 45.76 23 45.93 12 50.85 a. Forecast for period 24 using the following three methods: Exponential smoothing with alpha = 0.25; Moving average with n= 5; and Linear trend (2.5 marks) b. Using MAD, what is the best forecast method in Part a? (2.5 marks) c. Based on your answer in Part b, use a tracking signal to see whether there is any bias in error over time. In case of any bias in error what would be your recommendation? (5 marks) For tracking signal please: Important note: Calculate tracking signal from period 15 onwards. Use limits of 5 and a = 0.20 Use MAD for error calculations Brief explanation is required for each question. Case Study 2: UFE Clubs Case Study, (10 marks) UFE Clubs produces ball bearings. The diameter of the ball bearings is very important for the quality purposes. The following tables shows the diameters of 17 randomly selected samples in centimetres. Each sample contains four observations. Use control charts and run tests to see whether or not the process is under control. For run test z = 1. Sample Observation 1 Observation 2 Observation 3 Observation 4 1 31.22 24.01 31.75 22.49 2 31.67 32.43 29.78 27.54 3 27.83 25.37 26.49 25.83 4 31.48 28.02 30.21 31.86 5 28.27 30.99 28.62 25.46 6 28.23 24.44 32.56 32.41 7 24.58 26.89 27.11 32.36 8 28.16 29.47 22.32 30.78 9 28.21 29 32.88 24.69 10 32.15 29.18 24.84 31.29 11 23.91 24.65 29.29 22.32 12 23.20 29.23 29.31 26.36 13 23.54 31.11 31.81 26.56 14 30.64 26.94 29.23 32.29 15 31.87 32.48 24.56 25.51 16 29.33 23.36 23.36 25 17 27.02 23.05 31.19 28.44
Step by Step Solution
There are 3 Steps involved in it
a Forecast for period 24 using three methods 1 Exponential Smoothing with alpha 025 Forecast for period 2 77 initial forecast is the actual demand for ... View full answer

Get step-by-step solutions from verified subject matter experts