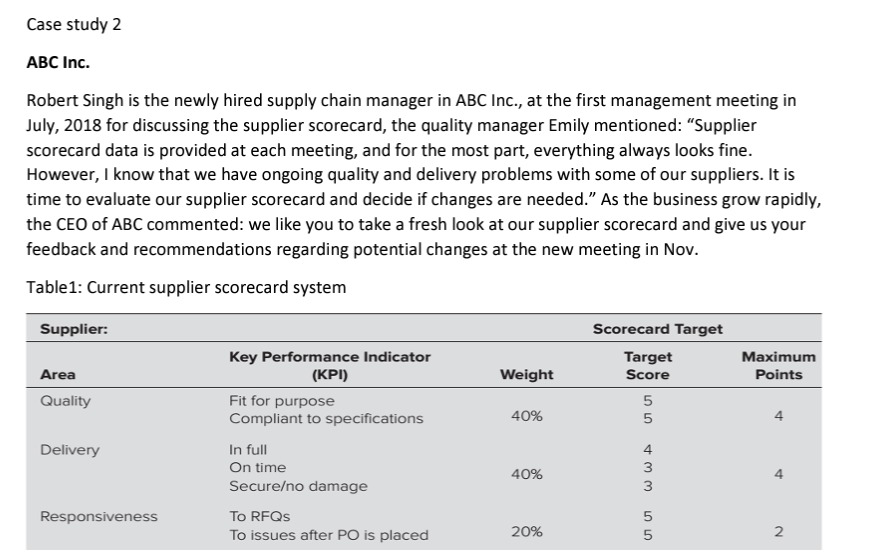
Question: Case study 2 ABC Inc. Robert Singh is the newly hired supply chain manager in ABC Inc., at the first management meeting in July, 2018

Case study 2 ABC Inc. Robert Singh is the newlyCase study 2 ABC Inc. Robert Singh is the newlyCase study 2 ABC Inc. Robert Singh is the newlyCase study 2 ABC Inc. Robert Singh is the newly
Case study 2 ABC Inc. Robert Singh is the newly hired supply chain manager in ABC Inc., at the first management meeting in July, 2018 for discussing the supplier scorecard, the quality manager Emily mentioned: "Supplier scorecard data is provided at each meeting, and for the most part, everything always looks fine. However, I know that we have ongoing quality and delivery problems with some of our suppliers. It is time to evaluate our supplier scorecard and decide if changes are needed." As the business grow rapidly, the CEO of ABC commented: we like you to take a fresh look at our supplier scorecard and give us your feedback and recommendations regarding potential changes at the new meeting in Nov. Table1: Current supplier scorecard system Supplier: Scorecard Target Key Performance Indicator Target Maximum Area (KPI) Weight Score Points Quality Fit for purpose UT UT Compliant to specifications 40% 4 Delivery In full 4 On time 40% 4 Secureo damage Responsiveness To RFQs To issues after PO is placed 20% 2Table1: Current scorecard-supplier record from June to Aug Supplier June July August Q* D* R* Overall Q* D* R* Overall Q* D* R* Overall Martin Foundry 40% 32% 20% 92% 40% 32% 20% 92% 32% 32% 20% 84% JBR Foundry 40% 40% 20% 100% 40% 32% 20% 92% 40% 32% 20% 92% Lawson Foundry 32% 20% 20% 72% 32% 20% 18% 70% 32% 20% 8% 60% NLX Bearings 40% 36% 20% 96% 40% 40% 20% 100% 40% 40% 20% 100% Mitchell Plastics 40% 36% 14% 90% 40% 40% 20% 100% 40% 40% 20% 100% Hoffman Electronics 32% 36% 20% 88% 32% 36% 20% 88% 32% 40% 20% 92% Scott Extrusions 40% 40% 12% 92% 40% 40% 12% 92% 40% 40% 20% 100% Collins Fasteners 32% 40% 20% 92% 40% 40% 20% 100% 40% 40% 20% 100% Innes Electrical 40% 40% 20% 100% 40% 40% 20% 100% 40% 40% 20% 100% Miller Electronic Services 32% 32% 20% 84% 32% 40% 20% 92% 28% 40% 20% 88% Rexel Foundry 40% 36% 20% 96% 40% 40% 20% 100% 40% 40% 20% 100% Tilden Exhibits 40% 40% 20% 100% 40% 40% 20% 100% 40% 40% 20% 100% EGT Extrusions 40% 32% 20% 92% 40% 40% 20% 100% 40% 40% 20% 100% TECH Electronics 40% 40% 20% 100% 40% 40% 20% 100% 28% 40% 20% 88% PKL Connectors 40% 40% 20% 100% 40% 40% 20% 100% 40% 32% 20% 92% Fletcher Machining 40% 40% 20% 100% 40% 40% 20% 100% 36% 40% 20% 96% Average 88% 90% 88%Robert described how the supplier data was collected and how the scorecard was used: "The supplier score-ca rd measures are mainly subjective with the exception of 'compliance to specification' in the quality section. Scorecard data was not communicated to suppliers, and the quality department determined if there was reasonable cause to initiate a meeting with a supplier based on poor performance.\" The new supplier scorecard developed by Robert would measure two areas, delivery performance, and conformance to specifications, split equally. Robert proposed that any supplier with a delivery score under 50 percent would be required to provide a root cause and corrective action report at a meeting with the buyer. Issues related to quality performance would be addressed by the quality department, including providing corrective action reports. Meetings with suppliers to address quality issues would be held at the discretion of the quality control manager and would involve purchasing as required. Robert felt that the new scorecard would hold both the suppliers and buyers accountable. He also liked that the new system would measure the performance of all suppliers. Table 3: proposed supplier scorecard-Martin Foundry Supplier: Martin Foundry Month: September Points This month Overall Score Reviewed by. Richard Ran'tsden 92% B Supplier contact Osman Peters This Month This lionth Mable Weight A B c D ($1 {more} On-time derivery ('36) 50% 9010095 7539395 ISOH.993 {50% 100% A Parts accepted (96} 50% >93% 9591996 9094936 {90% 84% D Overall } 10096 9510096 SIG94.9% 8539396 (35% 92% B Q4: What are the differences between the current scorecard and the proposed scorecard

Step by Step Solution

There are 3 Steps involved in it

1 Expert Approved Answer
Step: 1 Unlock blur-text-image
Question Has Been Solved by an Expert!

Get step-by-step solutions from verified subject matter experts

Step: 2 Unlock
Step: 3 Unlock

Students Have Also Explored These Related General Management Questions!