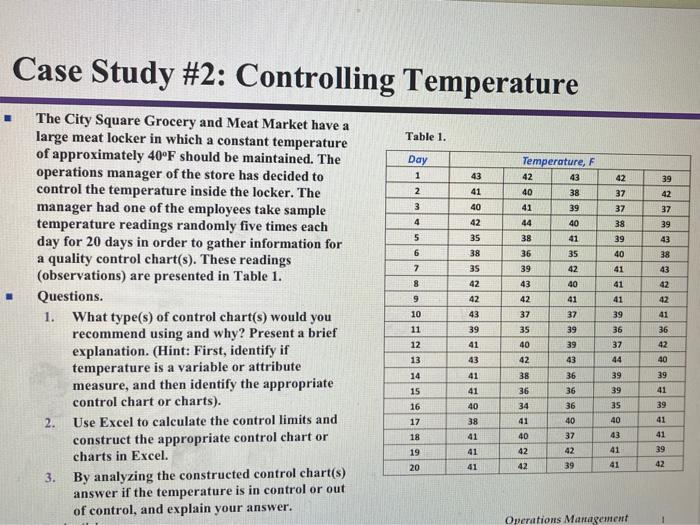
Question: Case Study #2: Controlling Temperature Table 1. Day 1 2 39 43 41 40 42 3 42 37 37 38 39 4 42 37 39

Case Study #2: Controlling Temperature Table 1.
Case Study #2: Controlling Temperature Table 1. Day 1 2 39 43 41 40 42 3 42 37 37 38 39 4 42 37 39 43 38 43 5 6 35 38 35 40 7 41 8 Temperature, F 42 43 40 38 41 39 44 40 38 41 36 35 39 42 43 40 42 41 37 37 35 39 40 39 42 43 38 36 36 36 42 41 42 9 42 41 The City Square Grocery and Meat Market have a large meat locker in which a constant temperature of approximately 40F should be maintained. The operations manager of the store has decided to control the temperature inside the locker. The manager had one of the employees take sample temperature readings randomly five times each day for 20 days in order to gather information for a quality control chart(s). These readings (observations) are presented in Table 1. Questions. 1. What type(s) of control chart(s) would you recommend using and why? Present a brief explanation. (Hint: First, identify if temperature is a variable or attribute measure, and then identify the appropriate control chart or charts). 2. Use Excel to calculate the control limits and construct the appropriate control chart or charts in Excel. 3. By analyzing the constructed control chart(s) answer if the temperature is in control or out of control, and explain your answer. 42 10 43 39 41 39 36 41 36 43 41 41 11 12 13 14 15 16 17 18 19 20 37 44 39 39 35 42 40 39 41 39 36 40 38 41 40 40 41 34 41 40 42 37 43 41 41 42 41 39 41 39 41 42 Operations Management

Step by Step Solution

There are 3 Steps involved in it

1 Expert Approved Answer
Step: 1 Unlock blur-text-image
Question Has Been Solved by an Expert!

Get step-by-step solutions from verified subject matter experts

Step: 2 Unlock
Step: 3 Unlock

Students Have Also Explored These Related General Management Questions!