

Question: CASE STUDY 2 (Least Squares Approximation-Discrete / other models) Annual Financial Highlight: SIME DARBY BERHAD (4197) 50000 46,955 45000 43,729 43,963 43,084 44,483 40000 35000
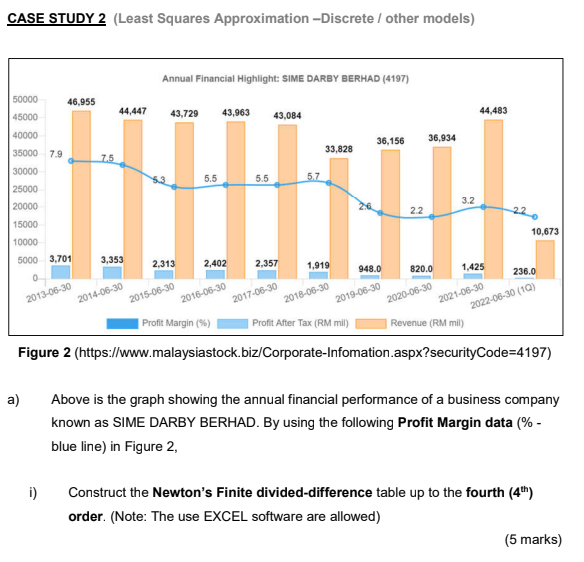
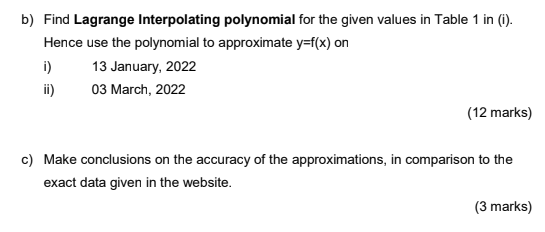
CASE STUDY 2 (Least Squares Approximation-Discrete / other models) Annual Financial Highlight: SIME DARBY BERHAD (4197) 50000 46,955 45000 43,729 43,963 43,084 44,483 40000 35000 7.9 36,156 33,828 30000 5.5 5.7 25000 20000 15000 2.2 10000 5000 3,701 2013-06-30 2,402 1,919 0 820.0 2014-06-30 2018-06-30 2020-06-30 Profit Margin (%) Profit After Tax (RM mil) Revenue (RM mil) Figure 2 (https://www.malaysiastock.biz/Corporate-Infomation.aspx?securityCode=4197) a) Above is the graph showing the annual financial performance of a business company known as SIME DARBY BERHAD. By using the following Profit Margin data (% - blue line) in Figure 2, i) Construct the Newton's Finite divided-difference table up to the fourth (4th) order. (Note: The use EXCEL software are allowed) (5 marks) 44,447 7.5 3,353 2,313 2015-06-30 5.5 2,357 2017-06-30 2016-06-30 948.0 2019-06-30 36,934 3.2 1,425 10,673 236.0 2022-06-30 (10) 2021-06-30 b) Find Lagrange Interpolating polynomial for the given values in Table 1 in (i). Hence use the polynomial to approximate y=f(x) on i) 13 January, 2022 ii) 03 March, 2022 (12 marks) c) Make conclusions on the accuracy of the approximations, in comparison to the exact data given in the website. (3 marks) CASE STUDY 2 (Least Squares Approximation-Discrete / other models) Annual Financial Highlight: SIME DARBY BERHAD (4197) 50000 46,955 45000 43,729 43,963 43,084 44,483 40000 35000 7.9 36,156 33,828 30000 5.5 5.7 25000 20000 15000 2.2 10000 5000 3,701 2013-06-30 2,402 1,919 0 820.0 2014-06-30 2018-06-30 2020-06-30 Profit Margin (%) Profit After Tax (RM mil) Revenue (RM mil) Figure 2 (https://www.malaysiastock.biz/Corporate-Infomation.aspx?securityCode=4197) a) Above is the graph showing the annual financial performance of a business company known as SIME DARBY BERHAD. By using the following Profit Margin data (% - blue line) in Figure 2, i) Construct the Newton's Finite divided-difference table up to the fourth (4th) order. (Note: The use EXCEL software are allowed) (5 marks) 44,447 7.5 3,353 2,313 2015-06-30 5.5 2,357 2017-06-30 2016-06-30 948.0 2019-06-30 36,934 3.2 1,425 10,673 236.0 2022-06-30 (10) 2021-06-30 b) Find Lagrange Interpolating polynomial for the given values in Table 1 in (i). Hence use the polynomial to approximate y=f(x) on i) 13 January, 2022 ii) 03 March, 2022 (12 marks) c) Make conclusions on the accuracy of the approximations, in comparison to the exact data given in the website
Step by Step Solution
There are 3 Steps involved in it

Get step-by-step solutions from verified subject matter experts