

Question: Case Study 2: Paragon Facility Solutions (20 Points) In September 2014, Tim Harris, CEO and president of Broadway Industries, a facility-services company based in Newark,
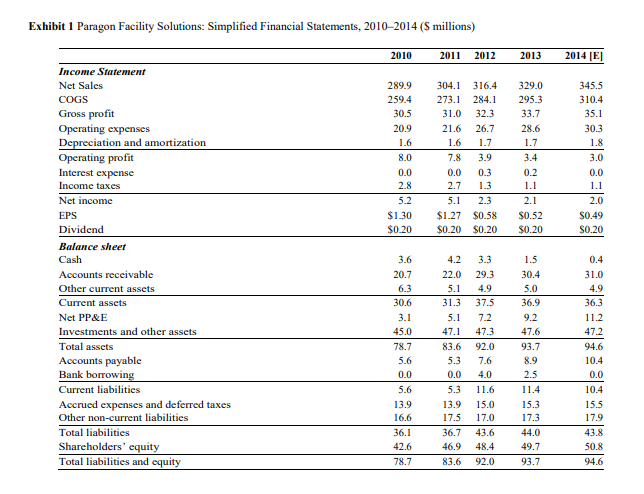
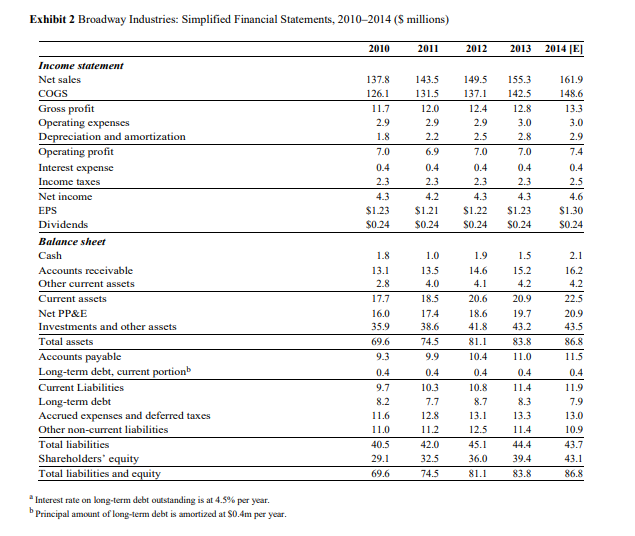
Case Study 2: Paragon Facility Solutions (20 Points) In September 2014, Tim Harris, CEO and president of Broadway Industries, a facility-services company based in Newark, New Jersey, sat in his office considering whether he should acquire Paragon Facility Solutions, a facility-services company based in Sacramento, California. He also was trying to decide whether to finance the acquisition entirely with debt or with a combination of equity and debt. Earlier that week, Harris had learned that, although willing to sell their company to Broadway, Paragons capital providers had stated they would accept no less than $120 million. Harris was excited about this opportunity, which he believed could be very valuable for Broadway. Nonetheless, two of Broadways board members strongly opposed this acquisition. Despite his enthusiasm, Harris was not sure how much Paragon was worth to Broadway, or how Broadway should finance the acquisition. He knew that he had to decide now, or he would miss this chance to make Broadway a truly integrated facility-services provider. Industry Background In 2013, organizations in the United States spent $120 billion on facility management. A typical facility manager provided comprehensive facility services, which included janitorial solutions, HVAC, commercial cleaning, facility engineering, energy solutions, landscaping, parking, and security, through stand-alone or integrated solutions. The industry comprised a few large integrated companies and many small, private players with specific industry or regional expertise, and was highly fragmented and competitive. This environment represented an opportunity for large companies that operated in multiple market segments. These firms began to diversify their services, offering bundled or integrated services to clients. They did so for two reasons. First, they wanted to use economies of scale to achieve cost reductions. Second, they wanted to offer a compelling value proposition that would enable them to realize premium pricing. Large corporate clients favored bundled contracts because they preferred to deal with one service provider that satisfied all of their needs. By bundling contracts, facility managers could improve client relationships, secure larger contracts, and increase brand recognition. Further, by diversifying services, providers expanded their expertise in specific industries (e.g., hospital, airport), often through horizontal acquisitions of players that specialized in a desired area. The integrated facility-services industry had experienced steady growth over the previous decade, and the demand for its services was expected to grow at 6% annually between 2014 and 2016. In contrast, the market for single-service contracts was forecasted to grow at 4% annually. Paragon Facility Solutions Paragon Facility Solutions was founded in 1956 as a regional janitorial services provider to commercial facilities in the Sacramento area. It grew quickly over the next three decades. By the late 2000s, it had become a large integrated provider to commercial customers. It specialized in building engineering and energy solutions, janitorial and commercial cleaning, and other general building maintenance and management. It serviced corporate campuses, headquarters, and research facilities for companies in the pharmaceutical, medical, high-tech, and consumer products sectors. By early 2014, Paragon Facility Solutions employed more than 5,000 employees and serviced more than 300 million square feet. It had more than 20 regional offices, in California, Arizona, Oregon, Washington, and British Columbia. Its major clients included large hospitals and several Fortune 500 biotechnology and pharmaceutical companies. Paragon had won several awards and been named regional supplier of the year. Its integrated technical services, such as mechanical and electrical engineering and energy management, were highly respected. In the western United States, it was known for its high-quality services and technical expertise, which enabled the company to charge a premium price for its services. Yet despite its ability to command premium prices, Paragons operating margin had declined from 3% in 2010 to less than 1% in 2014 as its operating expenses increased. (See Exhibit 1 for Paragons historical financial data.) Its cash balance was expected to decline to $400,000 by the end of fiscal year 2014, the lowest level in five years. Broadway Industries, Inc. Tim Harris founded Broadway Industries in 1982. By 2014, Broadway was providing janitorial services, floor and carpet maintenance, HVAC, and other building maintenance in the eastern United States. It had 12 regional offices from New England to Florida, and served industrial, retail, manufacturing, government, and education facilities. Harris wanted his 4 company to gain expertise in building engineering and energy solutions, in order to become a truly integrated service provider. (See Exhibit 2 for Broadways historical financial data.) As of 2014, he still maintained majority ownership. Acquisition opportunity Harris believed that acquiring Paragon would benefit Broadway. First, given recent industry consolidation and projected high growth for integrated facility services, the acquisition could enable Broadway to provide better bundled services to its existing customer base and therefore gain a bigger share in its home market. Paragons building engineering and energy solutions could also help Broadway gain new customers on the East Coast. Second, Broadway wished to enter the high-tech, biotechnology, and pharmaceutical industries in its home market. The acquisition could help Broadway gain market share in these segments in the eastern United States. In addition, Harris had always wanted to enter the West Coast market in order to create an integrated facility management company on a national scale. Acquiring Paragon would facilitate this goal. Further, Harris was well regarded within the industry for cultivating a culture of operational efficiency within Broadway. He believed that Paragons high operating costs, which had placed it in the bottom quartile of facility management companies, in terms of operating margin, had resulted from managerial complacency and cost mismanagement, rather than from some underlying flaw in the companys business model. Harris was confident that by replacing Paragons management team, cutting executive pay and lavish perquisites, and reducing non-essential marketing expenses, Broadway could increase Paragons operating margin to 3%. Harris had formed a task force of senior managers and external financial advisors to assess whether the acquisition was feasible and to help Broadway prepare its bid. After its investigation, the task force was convinced that Broadway could benefit greatly from this acquisition. The most obvious benefit of consolidating the two companies was the elimination of common overhead expenses, such as corporate headquarters, executives, support staff, and redundant office space. Another source of value would involve the management of Paragons net working capital; the task force believed that Paragons net working capital to sales ratio could be reduced to that of Broadway following improvements in some of Paragons processes. Finally, because Paragon was respected for its high-quality services and expertise, the task force believed the acquisition would enable Broadway to market some of its services under Paragons brand at a premium price. The task force concluded that any near-term risks of slower growth or declines in revenues, due to the premium pricing strategy, would be compensated for by the expected improvements in gross profit margin. It laid out the following projections. The task force expected Paragons revenue to grow at 5% per year from 2014 to 2019 and 4% per year thereafter, regardless of whether the acquisition occurred. In the expected (optimistic) scenario, the task force believed that under Broadways management, Paragons operating margin could increase to 1.5% in 2015, 2% in 2016, 2.5% in 2017, and 3% thereafter, compared to 1% at present. By actively managing net working capital, non-cash net working capital as a percentage of sales was expected to decline to 7% in 2015, 6.5% in 2016, 6.3% in 2017, 6% in 2018, and 5.5% thereafter, rather than 7.4% under the old management. Capital expenditures were expected to remain at 1% of annual sales, and depreciation would increase by $300,000 per year in the foreseeable future, regardless of the acquisition. As a result, Paragons projected free cash flows were expected to grow at 4% annually, after 2019. It expected the corporate tax rate to remain at 35% per year. (See Exhibits 3a and 3b for the five-year forecasts of Paragons and Broadways financial statements, if no acquisition occurred.) Nonetheless, the task force had doubts and reservations about its assumptions regarding management and net working capital. Nor was it certain whether Broadways accounting team and financial officers could manage the larger, more complex organization. Managing a combined entity double the size of Broadway, with coast-to-coast operations, would be challenging. The premium pricing strategy might not work, and forecasted increases in operating margins might be too optimistic. In a pessimistic scenario, Paragons net working capital would be 7% of sales from 2015 to 2017 and 6.5% in 2018 and thereafter. Its operating margin would reach a steady state of 2.5% by 2017 and thereafter. All other projections would be the same as in the expected scenario. The market reaction to the proposed acquisition had been mixed. Some investment banks reacted negatively to it, citing concern about whether Broadway could manage the combined business and effectively implement the proposed costcutting measures. Some of Broadways board members and shareholders expressed similar views. Further, the board was 5 unconvinced about the new pricing strategy and service model, and improvements to working capital. However, Stanley Investment Company, a major investment bank, was confident that the acquisition would benefit both companies and that financing for the acquisition could be arranged. In order to facilitate the analysis, the task force gathered financial information for three comparable companies in the facility management industry (see Exhibit 4). It also gathered the relevant capital market information (see Exhibit 5). Harris wondered which direction he should take the company he had started more than 30 years ago. He was confident that Paragon would be a strong addition to Broadway, but he also sensed concern from his team of financial advisors and reluctance from his fellow board members at Broadway. Could he justify meeting the purchase price demanded by Paragon? If he made the acquisition, what would be the best way to finance the transaction to ensure the viability of Paragon and maximize the value to Broadway?
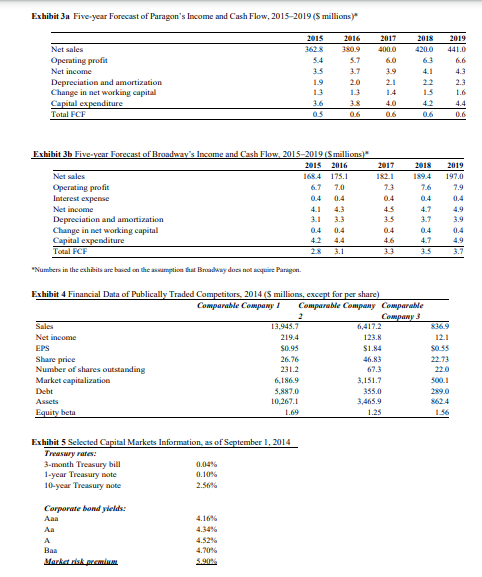
What is your estimate of the after-tax cost of debt component of capital based on Paragons credit rating?
Based on beta of the proxy firm and market data, what is the firms appropriate cost of equity capital?
8. What is your estimate of WACC for valuing the acquisition of Paragon?
(b) You are tasked to estimate the enterprise value (EV) of the target firm based on the expected (optimistic scenario) synergistic benefits identified by the task force. Estimate the free cash flows to the firm (FCFF) over the 5-year forecast period and steady-state cash flow in year 6. Answer the following questions.
9. Based on your cash flow projection, what is the after-tax net operation income (NOPAT) in year-3 ___________ and year-4 ______________?
10. What is your estimate of the change in net working capital in year-3 __________ and year-4 ___________?
11. What is your estimate of the total FCFF in year-3 ___________ and year-4 ____________?
12. What is your estimate of the terminal value in year-5 _____________?
13. Based on your FCFF estimate and the discount rate, what is the total enterprise value of the target firm with synergies under the expected (optimistic) scenario ______________?
14. Based on your estimate of enterprise value, should Harris proceed with his $120 million bid for the acquisition of Paragon? Why? or why not? Briefly explain.
Exhibit 1 Paragon Facility Solutions: Simplified Financial Statements, 2010-2014 ($ millions) 2010 2011 2012 2013 2014 LEI 289.9 259.4 30.5 20.9 1.6 8.0 0.0 2.8 5.2 $1.30 $0.20 304.1 273.1 31.0 21.6 1.6 7.8 0.0 2.7 5.1 $1.27 $0.20 316.4 284.1 32.3 26.7 1.7 3.9 0.3 1.3 2.3 $0.58 $0.20 329.0 295.3 33.7 28.6 1.7 3.4 0.2 1.1 2.1 $0.52 $0.20 345.5 310.4 35.1 30.3 1.8 3.0 0.0 1.1 2.0 S0.49 S0.20 Income Statement Net Sales COGS Gross profit Operating expenses Depreciation and amortization Operating profit Interest expense Income taxes Net income EPS Dividend Balance sheer Cash Accounts receivable Other current assets Current assets Net PP&E Investments and other assets Total assets Accounts payable Bank borrowing Current liabilities Accrued expenses and deferred taxes Other non-current liabilities Total liabilities Shareholders' equity Total liabilities and equity 4.2 22.0 5.1 31.3 5.1 47.1 1.5 30.4 5.0 36.9 9.2 47.6 93.7 83.6 3.6 20.7 6.3 30.6 3.1 45.0 78.7 5.6 0.0 5.6 13.9 16.6 36.1 42.6 78.7 5.3 0.0 5.3 13.9 17.5 36.7 46.9 83.6 3.3 29.3 4.9 37.5 7.2 47.3 92.0 7.6 4.0 11.6 15.0 17.0 43.6 48.4 92.0 0.4 31.0 4.9 36.3 11.2 47.2 94.6 10.4 0.0 10.4 15.5 17.9 43.8 50.8 94.6 2.5 11.4 15.3 17.3 44.0 49.7 93.7 Exhibit 2 Broadway Industries: Simplified Financial Statements, 2010-2014 (millions) 2010 2011 2012 2013 2014 LEI 137.8 126.1 11.7 2.9 1.8 7.0 0.4 2.3 4.3 $1.23 $0.24 143.5 131.5 12.0 2.9 22 6.9 0.4 2.3 4.2 $1.21 $0.24 149.5 137.1 12.4 2.9 2.5 7.0 0.4 2.3 4.3 $1.22 S0.24 155.3 142.5 12.8 3.0 2.8 7.0 0.4 2.3 4.3 $1.23 S0.24 161.9 148.6 13.3 3.0 2.9 7.4 0.4 2.5 4.6 $1.30 S0.24 1.5 Income statement Net sales COGS Gross profit Operating expenses Depreciation and amortization Operating profit Interest expense Income taxes Net income EPS Dividends Balance sheet Cash Accounts receivable Other current assets Current assets Net PP&E Investments and other assets Total assets Accounts payable Long-term debt, current portion Current Liabilities Long-term debt Accrued expenses and deferred taxes Other non-current liabilities Total liabilities Shareholders' equity Total liabilities and equity 15.2 1.8 13.1 2.8 17.7 16.0 35.9 69.6 9.3 1.0 13.5 4.0 18.5 17.4 38.6 74.5 9.9 1.9 14.6 4.1 20.6 18.6 41.8 81.1 4.2 20.9 19.7 43.2 83.8 11.0 2.1 16.2 4.2 22.5 20.9 43.5 86.8 11.5 10.4 0.4 9.7 8.2 11.6 11.0 40.5 29.1 69.6 0.4 10.3 7.7 12.8 11.2 42.0 32.5 74.5 0.4 10.8 8.7 13.1 12.5 45.1 36.0 81.1 0.4 11.4 8.3 13.3 11.4 44.4 39.4 83.8 0.4 11.9 7.9 13.0 10.9 43.7 43.1 86.8 b Interest rate on long-term debt outstanding is at 4.5% per year. Principal amount of long-term debt is amortized at S0.4m per year. Exhibit 3a Five-year Forecast of Paragon's Income and Cash Flow, 2015-2019 (5 millions)" 2015 2017 4000 6.0 2018 4200 2016 2009 5.7 3.7 20 2019 441.0 6.6 5.4 35 Net sales Operating profit Net income Depreciation and amortization Change in net working capital Capital expenditure Total FCF 4.1 40 23 1.6 4.4 0.6 36 05 15 42 0.6 3.& 0.6 06 2017 182.1 73 0.4 189.4 2019 197.0 7.9 Exhibit 3b Five-year Forecast of Broadway's Income and Cash Flow, 2015-2019 (Smillions) 2015 2016 Net sales 168.4 175.1 Operating profit 6.7 7.0 Interest expense 0.4 Net income Depreciation and amortization Change in networking capital 0.4 0.4 Capital expenditure Total FCF 3.1 0.4 4.7 3.7 0.4 4.7 35 0.4 4.9 3.9 0.4 35 0.4 4.6 33 3.7 "Numbers in the exhibits are well on the ti that Broadway does not qui Parigen. Exhibit 4 Financial Data of Publically Traded Competitors 2014 (5 millions, except for per share) Comparable Company 1 Comparable Company Comparable 2 Company 3 Sales 13.943.7 6,417.2 836.9 Net income 219.4 123.8 12.1 EPS $0.93 $1.84 SO 35 Share price 26.76 46.83 22.73 Number of shares outstanding 231.2 67.3 22.0 Market capitalization 6.186.9 3,151.7 500.1 Debt 3.887.0 355.0 289.0 Assets 10.267.1 3,465.9 62.4 Equity beta 1.69 1.25 Exhibit 5 Selected Capital Markets Information, as of September 1, 2014 Treeswyrales: 3-month Treasury bill 0.04% 1-year Treasury note 0.10% 10-year Treasury note 2.56% Carporte hond yields: Aaa Aa A Baa Markduk .com 4.52% 4.70% 5,90% Exhibit 1 Paragon Facility Solutions: Simplified Financial Statements, 2010-2014 ($ millions) 2010 2011 2012 2013 2014 LEI 289.9 259.4 30.5 20.9 1.6 8.0 0.0 2.8 5.2 $1.30 $0.20 304.1 273.1 31.0 21.6 1.6 7.8 0.0 2.7 5.1 $1.27 $0.20 316.4 284.1 32.3 26.7 1.7 3.9 0.3 1.3 2.3 $0.58 $0.20 329.0 295.3 33.7 28.6 1.7 3.4 0.2 1.1 2.1 $0.52 $0.20 345.5 310.4 35.1 30.3 1.8 3.0 0.0 1.1 2.0 S0.49 S0.20 Income Statement Net Sales COGS Gross profit Operating expenses Depreciation and amortization Operating profit Interest expense Income taxes Net income EPS Dividend Balance sheer Cash Accounts receivable Other current assets Current assets Net PP&E Investments and other assets Total assets Accounts payable Bank borrowing Current liabilities Accrued expenses and deferred taxes Other non-current liabilities Total liabilities Shareholders' equity Total liabilities and equity 4.2 22.0 5.1 31.3 5.1 47.1 1.5 30.4 5.0 36.9 9.2 47.6 93.7 83.6 3.6 20.7 6.3 30.6 3.1 45.0 78.7 5.6 0.0 5.6 13.9 16.6 36.1 42.6 78.7 5.3 0.0 5.3 13.9 17.5 36.7 46.9 83.6 3.3 29.3 4.9 37.5 7.2 47.3 92.0 7.6 4.0 11.6 15.0 17.0 43.6 48.4 92.0 0.4 31.0 4.9 36.3 11.2 47.2 94.6 10.4 0.0 10.4 15.5 17.9 43.8 50.8 94.6 2.5 11.4 15.3 17.3 44.0 49.7 93.7 Exhibit 2 Broadway Industries: Simplified Financial Statements, 2010-2014 (millions) 2010 2011 2012 2013 2014 LEI 137.8 126.1 11.7 2.9 1.8 7.0 0.4 2.3 4.3 $1.23 $0.24 143.5 131.5 12.0 2.9 22 6.9 0.4 2.3 4.2 $1.21 $0.24 149.5 137.1 12.4 2.9 2.5 7.0 0.4 2.3 4.3 $1.22 S0.24 155.3 142.5 12.8 3.0 2.8 7.0 0.4 2.3 4.3 $1.23 S0.24 161.9 148.6 13.3 3.0 2.9 7.4 0.4 2.5 4.6 $1.30 S0.24 1.5 Income statement Net sales COGS Gross profit Operating expenses Depreciation and amortization Operating profit Interest expense Income taxes Net income EPS Dividends Balance sheet Cash Accounts receivable Other current assets Current assets Net PP&E Investments and other assets Total assets Accounts payable Long-term debt, current portion Current Liabilities Long-term debt Accrued expenses and deferred taxes Other non-current liabilities Total liabilities Shareholders' equity Total liabilities and equity 15.2 1.8 13.1 2.8 17.7 16.0 35.9 69.6 9.3 1.0 13.5 4.0 18.5 17.4 38.6 74.5 9.9 1.9 14.6 4.1 20.6 18.6 41.8 81.1 4.2 20.9 19.7 43.2 83.8 11.0 2.1 16.2 4.2 22.5 20.9 43.5 86.8 11.5 10.4 0.4 9.7 8.2 11.6 11.0 40.5 29.1 69.6 0.4 10.3 7.7 12.8 11.2 42.0 32.5 74.5 0.4 10.8 8.7 13.1 12.5 45.1 36.0 81.1 0.4 11.4 8.3 13.3 11.4 44.4 39.4 83.8 0.4 11.9 7.9 13.0 10.9 43.7 43.1 86.8 b Interest rate on long-term debt outstanding is at 4.5% per year. Principal amount of long-term debt is amortized at S0.4m per year. Exhibit 3a Five-year Forecast of Paragon's Income and Cash Flow, 2015-2019 (5 millions)" 2015 2017 4000 6.0 2018 4200 2016 2009 5.7 3.7 20 2019 441.0 6.6 5.4 35 Net sales Operating profit Net income Depreciation and amortization Change in net working capital Capital expenditure Total FCF 4.1 40 23 1.6 4.4 0.6 36 05 15 42 0.6 3.& 0.6 06 2017 182.1 73 0.4 189.4 2019 197.0 7.9 Exhibit 3b Five-year Forecast of Broadway's Income and Cash Flow, 2015-2019 (Smillions) 2015 2016 Net sales 168.4 175.1 Operating profit 6.7 7.0 Interest expense 0.4 Net income Depreciation and amortization Change in networking capital 0.4 0.4 Capital expenditure Total FCF 3.1 0.4 4.7 3.7 0.4 4.7 35 0.4 4.9 3.9 0.4 35 0.4 4.6 33 3.7 "Numbers in the exhibits are well on the ti that Broadway does not qui Parigen. Exhibit 4 Financial Data of Publically Traded Competitors 2014 (5 millions, except for per share) Comparable Company 1 Comparable Company Comparable 2 Company 3 Sales 13.943.7 6,417.2 836.9 Net income 219.4 123.8 12.1 EPS $0.93 $1.84 SO 35 Share price 26.76 46.83 22.73 Number of shares outstanding 231.2 67.3 22.0 Market capitalization 6.186.9 3,151.7 500.1 Debt 3.887.0 355.0 289.0 Assets 10.267.1 3,465.9 62.4 Equity beta 1.69 1.25 Exhibit 5 Selected Capital Markets Information, as of September 1, 2014 Treeswyrales: 3-month Treasury bill 0.04% 1-year Treasury note 0.10% 10-year Treasury note 2.56% Carporte hond yields: Aaa Aa A Baa Markduk .com 4.52% 4.70% 5,90%
Step by Step Solution
There are 3 Steps involved in it

Get step-by-step solutions from verified subject matter experts