

Question: Case Study 2: The first part of this case, given as Case Study 1 , discussed the situation of Computron Industries after an expansion program.
Case Study 2: The first part of this case, given as Case Study 1, discussed the situation of Computron Industries after an expansion program. A large loss occurred in 2015, rather than the expected profit. As a result, its managers, directors, and investors are concerned about the firm's survival.
Jenny Cochran was brought in as assistant to Gary Meissner, Computron's chairman, who had the task of getting the company back into a sound financial position. Computron's 2014 and 2015 balance sheets and income statements, together with projections for 2016, are shown in the following tables. The tables also show the 2014 and 2015 financial ratios. The 2016 projected financial statement data represent Cochran's and Meissner's best guess for 2016 results, assuming that some new financing is arranged to get the company "over the hump."
Cochran must prepare an analysis of where the company is now, what it must do to regain its financial health, and what actions should be taken. Your assignment is to help her answer the following questions.
Based on the following Balance Sheets, Income Statements, Other Data and Ratio tables given below, answer the question below.
QUESTION:
a What is the 2016's Net Profit Margin?
b What is Company's 2016's return on assets (ROA)? Suppose industry average ROA is expected to be 9%, what can you say about Computron's performance in 2016?
c Calculate the 2016's return on equity (ROE).
d Calculate the 2016's Basic Earning Power.
e What is 2016's price/earnings ratio?
f What is the 2016's price/cash flow ratio?
g What is Computron's 2016's market/book ratio?
h Calculate Comutron's 2016's book value per share.
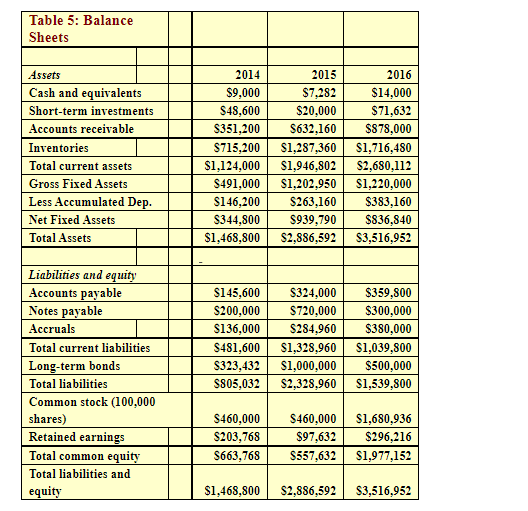
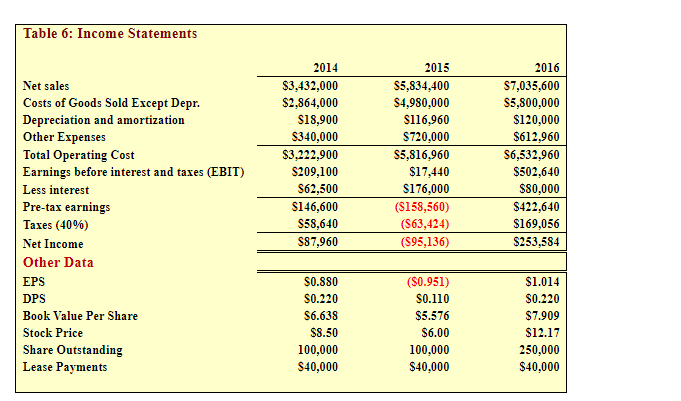
Table 5: Balance Sheets Assets Cash and equivalents Short-term investments Accounts receivable Inventories Total current assets Gross Fixed Assets Less Accumulated Dep. Net Fixed Assets Total Assets 2014 $9,000 $48,600 $351,200 $715,200 $1,124,000 S491,000 S146,200 S344,800 $1,468,800 2015 $7,282 $20,000 S632,160 $1,287,360 $1,946,802 S1,202,950 S263,160 $939,790 $2,886,592 2016 $14,000 $71,632 $878,000 $1,716,480 $2,680,112 $1,220,000 $383,160 $836,840 $3,516,952 Liabilities and equity Accounts payable Notes payable Accruals Total current liabilities Long-term bonds Total liabilities Common stock (100,000 shares) Retained earnings Total common equity Total liabilities and equity $145,600 S200,000 S136,000 S481,600 $323,432 S805,032 $324,000 $720,000 $284,960 $1,328,960 $1,000,000 $2,328,960 $359,800 $300,000 $380,000 $1,039,800 $500,000 $1,539,800 S460,000 S203,768 S663,768 S460,000 $97,632 $557,632 $1,680,936 $296,216 $1,977,152 $1,468,800 S2,886,592 $3,516,952 Table 6: Income Statements 2015 Net sales Costs of Goods Sold Except Depr. Depreciation and amortization Other Expenses Total Operating Cost Earnings before interest and taxes (EBIT) Less interest Pre-tax earnings Taxes (40%) Net Income Other Data EPS DPS Book Value Per Share Stock Price Share Outstanding Lease Payments 2014 $3,432,000 $2,864,000 S18,900 $340,000 $3,222,900 $209,100 S62,500 $146,600 $58,640 S87,960 $5,834,400 $4,980,000 $116,960 $720,000 $5,816,960 $17,440 $176,000 ($158,560) (563,424) (595,136) 2016 $7,035,600 $5,800,000 $120,000 $612,960 S6,532,960 $502,640 $80,000 $422,640 $169,056 $253,584 S0.880 $0.220 S6.638 $8.50 100,000 S40,000 ($0.951) $0.110 $5.576 $6.00 100,000 $40,000 $1.014 $0.220 $7.909 $12.17 250,000 $40,000 Table 5: Balance Sheets Assets Cash and equivalents Short-term investments Accounts receivable Inventories Total current assets Gross Fixed Assets Less Accumulated Dep. Net Fixed Assets Total Assets 2014 $9,000 $48,600 $351,200 $715,200 $1,124,000 S491,000 S146,200 S344,800 $1,468,800 2015 $7,282 $20,000 S632,160 $1,287,360 $1,946,802 S1,202,950 S263,160 $939,790 $2,886,592 2016 $14,000 $71,632 $878,000 $1,716,480 $2,680,112 $1,220,000 $383,160 $836,840 $3,516,952 Liabilities and equity Accounts payable Notes payable Accruals Total current liabilities Long-term bonds Total liabilities Common stock (100,000 shares) Retained earnings Total common equity Total liabilities and equity $145,600 S200,000 S136,000 S481,600 $323,432 S805,032 $324,000 $720,000 $284,960 $1,328,960 $1,000,000 $2,328,960 $359,800 $300,000 $380,000 $1,039,800 $500,000 $1,539,800 S460,000 S203,768 S663,768 S460,000 $97,632 $557,632 $1,680,936 $296,216 $1,977,152 $1,468,800 S2,886,592 $3,516,952 Table 6: Income Statements 2015 Net sales Costs of Goods Sold Except Depr. Depreciation and amortization Other Expenses Total Operating Cost Earnings before interest and taxes (EBIT) Less interest Pre-tax earnings Taxes (40%) Net Income Other Data EPS DPS Book Value Per Share Stock Price Share Outstanding Lease Payments 2014 $3,432,000 $2,864,000 S18,900 $340,000 $3,222,900 $209,100 S62,500 $146,600 $58,640 S87,960 $5,834,400 $4,980,000 $116,960 $720,000 $5,816,960 $17,440 $176,000 ($158,560) (563,424) (595,136) 2016 $7,035,600 $5,800,000 $120,000 $612,960 S6,532,960 $502,640 $80,000 $422,640 $169,056 $253,584 S0.880 $0.220 S6.638 $8.50 100,000 S40,000 ($0.951) $0.110 $5.576 $6.00 100,000 $40,000 $1.014 $0.220 $7.909 $12.17 250,000 $40,000
Step by Step Solution
There are 3 Steps involved in it

Get step-by-step solutions from verified subject matter experts