

Question: CASE STUDY 2.5 Segmented supply chain strategy process at Kimberly-Clark Europe For more than a century, Kimberly Clark (K-C) has supplied personal care products and
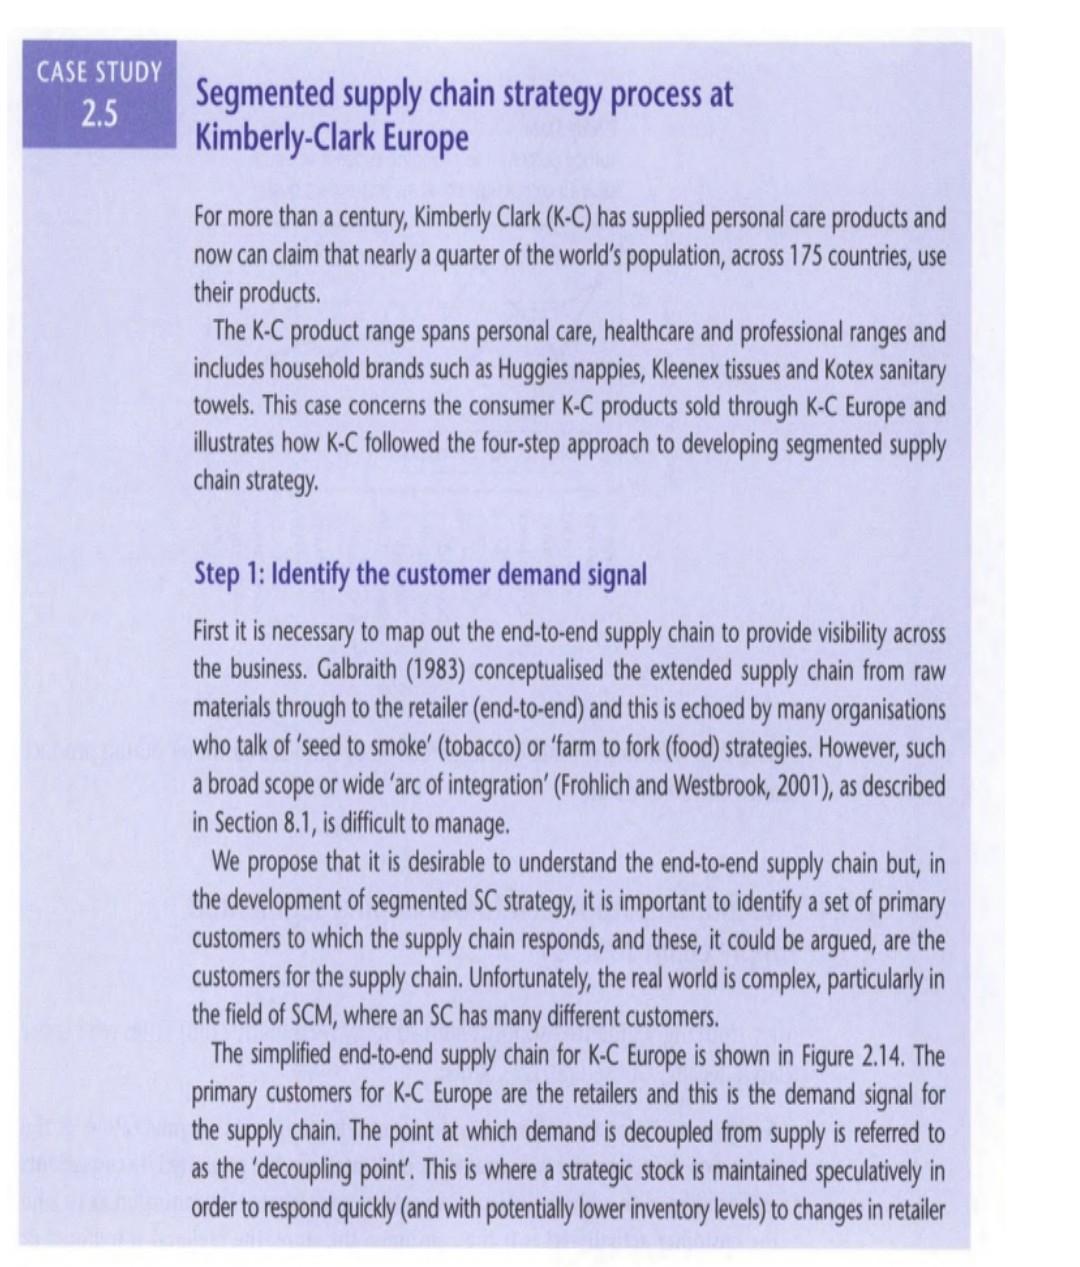
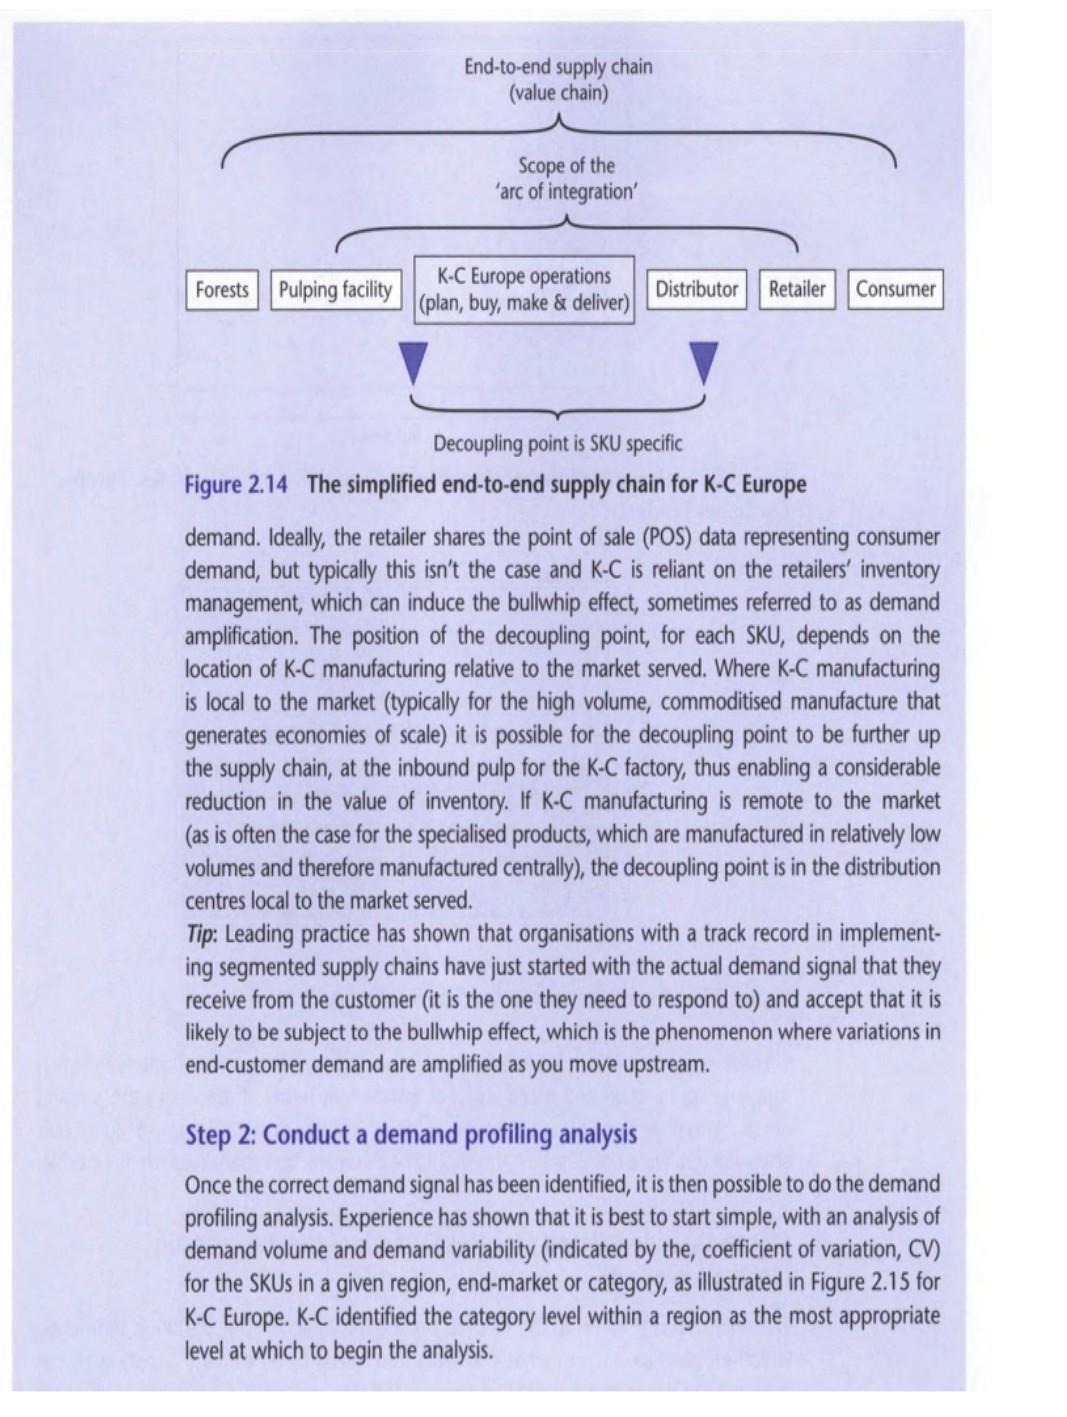
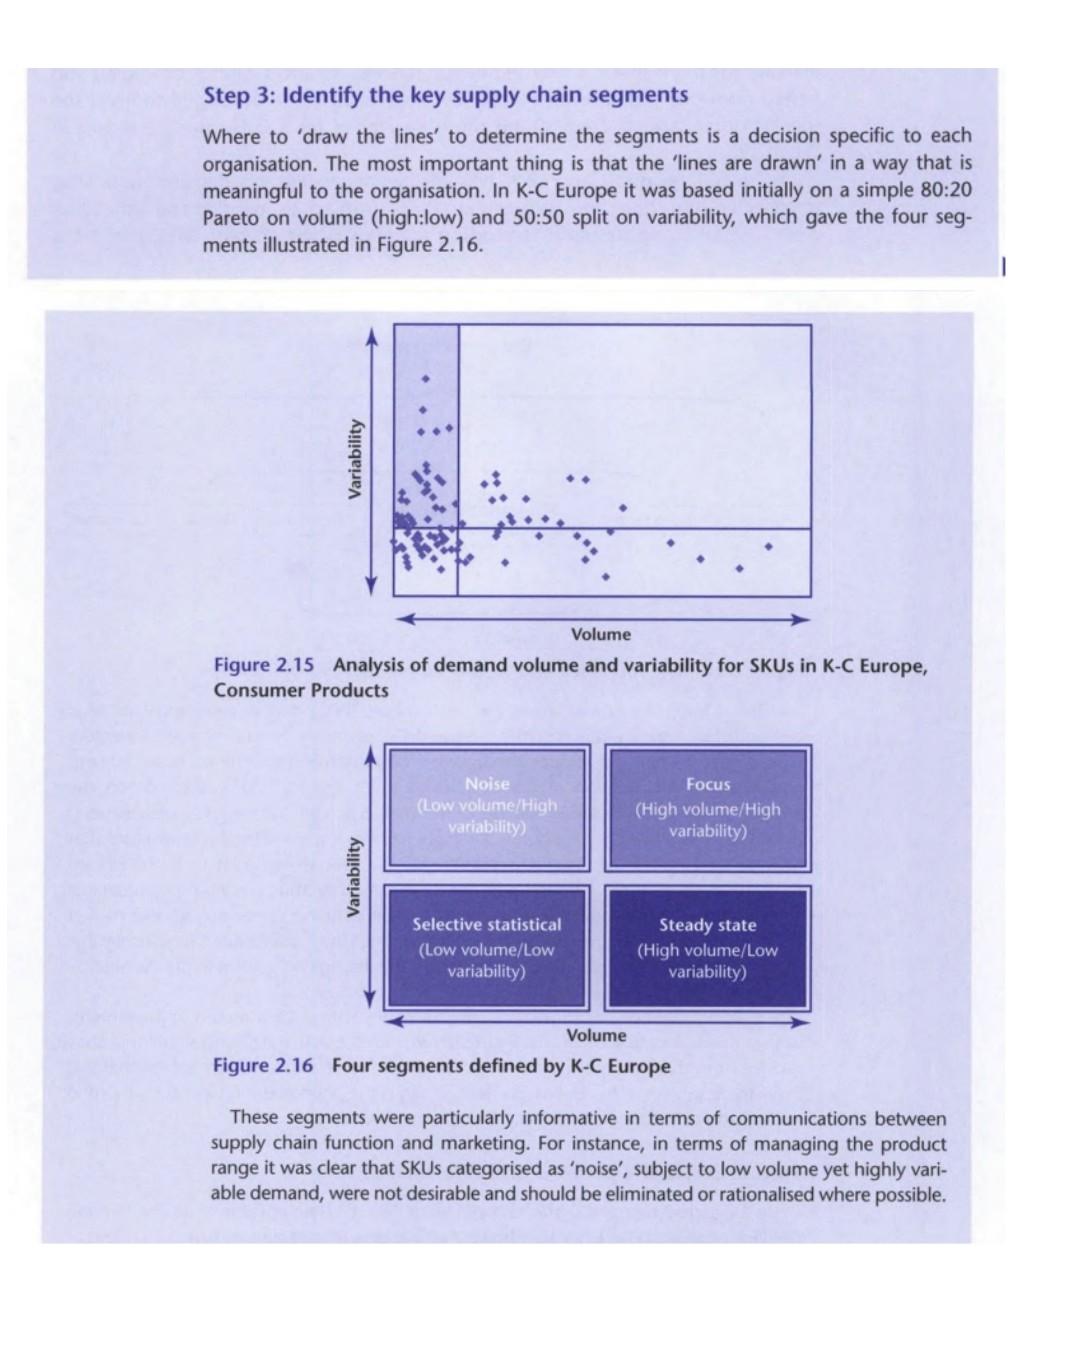
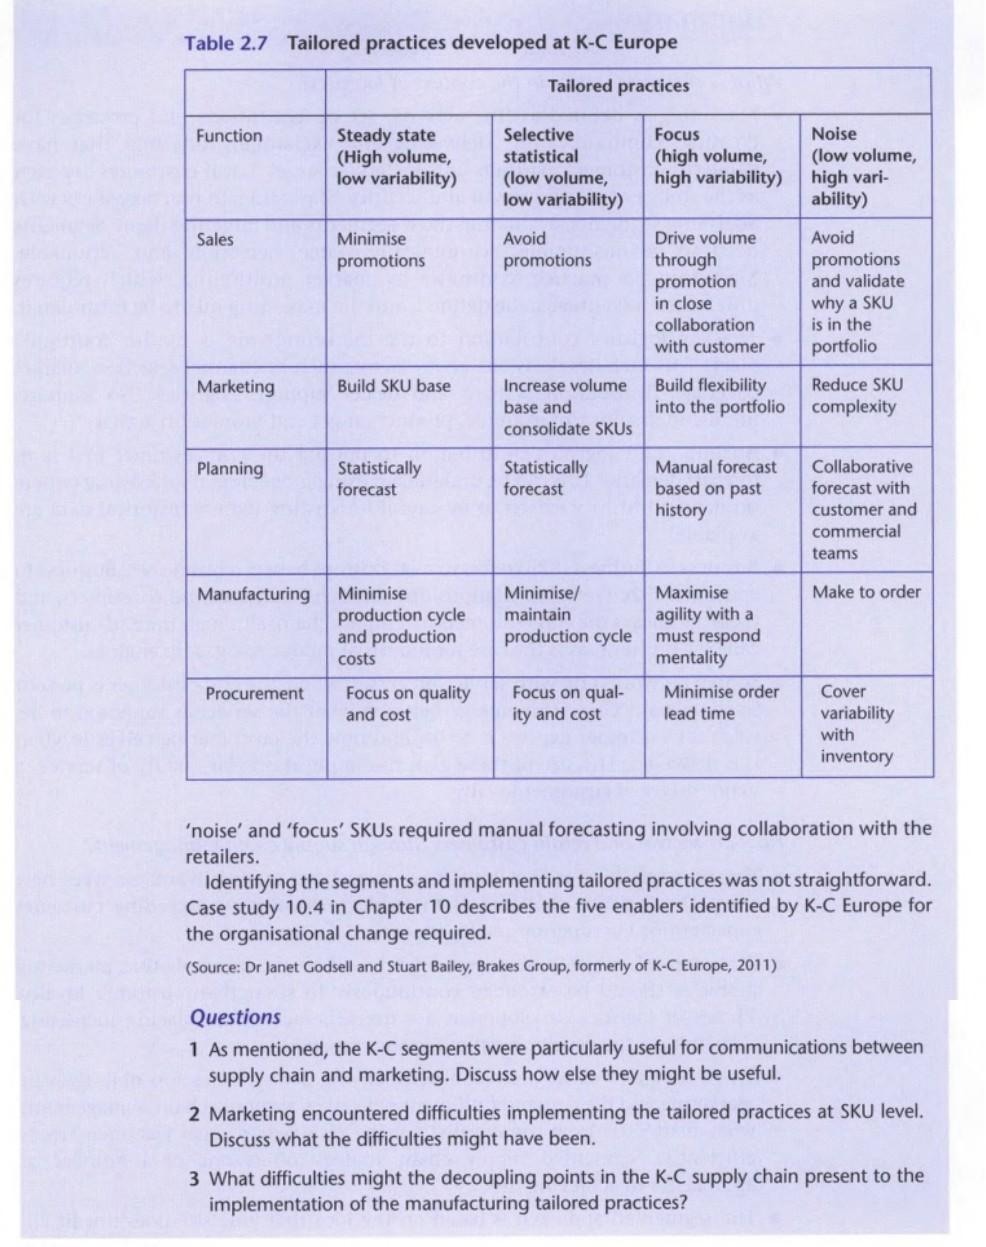
CASE STUDY 2.5 Segmented supply chain strategy process at Kimberly-Clark Europe For more than a century, Kimberly Clark (K-C) has supplied personal care products and now can claim that nearly a quarter of the world's population, across 175 countries, use their products . The K-C product range spans personal care, healthcare and professional ranges and includes household brands such as Huggies nappies, Kleenex tissues and Kotex sanitary towels. This case concerns the consumer K-C products sold through K-C Europe and illustrates how K-C followed the four-step approach to developing segmented supply chain strategy Step 1: Identify the customer demand signal First it is necessary to map out the end-to-end supply chain to provide visibility across the business. Galbraith (1983) conceptualised the extended supply chain from raw materials through to the retailer (end-to-end) and this is echoed by many organisations who talk of 'seed to smoke' (tobacco) or "farm to fork (food) strategies. However, such a broad scope or wide 'arc of integration' (Frohlich and Westbrook, 2001), as described in Section 8.1, is difficult to manage. We propose that it is desirable to understand the end-to-end supply chain but, in the development of segmented SC strategy, it is important to identify a set of primary customers to which the supply chain responds, and these, it could be argued, are the customers for the supply chain. Unfortunately , the real world is complex, particularly in the field of SCM, where an SC has many different customers. The simplified end-to-end supply chain for K-C Europe is shown in Figure 2.14. The primary customers for K-C Europe are the retailers and this is the demand signal for the supply chain. The point at which demand is decoupled from supply is referred to as the 'decoupling point' . This is where a strategic stock is maintained speculatively in order to respond quickly and with potentially lower inventory levels) to changes in retailer End-to-end supply chain (value chain) Scope of the 'arc of integration K-C Europe operations Forests Pulping facility (plan, buy, make & deliver) Distributor Retailer Consumer Decoupling point is SKU specific Figure 2.14 The simplified end-to-end supply chain for K-C Europe demand. Ideally, the retailer shares the point of sale (POS) data representing consumer demand, but typically this isn't the case and K-C is reliant on the retailers' inventory management, which can induce the bullwhip effect, sometimes referred to as demand amplification. The position of the decoupling point, for each SKU, depends on the location of K-C manufacturing relative to the market served. Where K-C manufacturing is local to the market (typically for the high volume, commoditised manufacture that generates economies of scale) it is possible for the decoupling point to be further up the supply chain, at the inbound pulp for the K-C factory, thus enabling a considerable reduction in the value of inventory. If K-C manufacturing is remote to the market (as is often the case for the specialised products , which are manufactured in relatively low volumes and therefore manufactured centrally), the decoupling point is in the distribution centres local to the market served. Tip: Leading practice has shown that organisations with a track record in implement- ing segmented supply chains have just started with the actual demand signal that they receive from the customer (it is the one they need to respond to) and accept that it is likely to be subject to the bullwhip effect, which is the phenomenon where variations in end-customer demand are amplified as you move upstream. Step 2: Conduct a demand profiling analysis Once the correct demand signal has been identified, it is then possible to do the demand profiling analysis. Experience has shown that it is best to start simple, with an analysis of demand volume and demand variability (indicated by the, coefficient of variation, CV) for the SKUs in a given region, end-market or category, as illustrated in Figure 2.15 for K-C Europe. K-C identified the category level within a region as the most appropriate level at which to begin the analysis. Step 3: Identify the key supply chain segments Where to 'draw the lines' to determine the segments is a decision specific to each organisation. The most important thing is that the 'lines are drawn' in a way that is meaningful to the organisation. In K-C Europe it was based initially on a simple 80:20 Pareto on volume (high:low) and 50:50 split on variability, which gave the four seg- ments illustrated in Figure 2.16. Variability Volume Figure 2.15 Analysis of demand volume and variability for SKUs in K-C Europe, Consumer Products Noise (Low volume/High variability Focus (High volume/High variability) Variability Selective statistical (Low volume/Low variability) Steady state (High volume/Low variability) Volume Figure 2.16 Four segments defined by K-C Europe These segments were particularly informative in terms of communications between supply chain function and marketing. For instance, in terms of managing the product range it was clear that SKUs categorised as 'noise', subject to low volume yet highly vari- able demand, were not desirable and should be eliminated or rationalised where possible. Step 4: Develop tailored practices for each of the supply chain functions involved The final step is to develop the tailored practices for each of the identified segments, which involves identifying what each function needs to do to align supply with the demand for the respective SKU segments. Tailored practices cannot be copied and pasted from one organisation to another. They need to be developed to meet the specific organisational context and those developed for K-C Europe are shown in Table 2.7. The sales forecasting approach was mainly dependent on demand variability, so 'selective statistical and 'steady state' SKUs (subject to low demand variability) were forecast using statistical forecasting methods based on past sales, whilst the Table 2.7 Tailored practices developed at K-C Europe Tailored practices Function Steady state (High volume, low variability) Selective statistical (low volume, low variability) Focus (high volume, high variability) Sales Minimise promotions Avoid promotions Drive volume through promotion in close collaboration with customer Noise (low volume, high vari- ability) Avoid promotions and validate why a SKU is in the portfolio Marketing Build SKU base Increase volume base and consolidate SKUs Build flexibility Reduce SKU into the portfolio complexity Planning Statistically forecast Statistically forecast Manual forecast based on past history Collaborative forecast with customer and commercial teams Manufacturing Make to order Minimise production cycle and production costs Minimise/ Maximise maintain agility with a production cycle must respond mentality Focus on qual- Minimise order ity and cost lead time Procurement Focus on quality and cost Cover variability with inventory 'noise' and 'focus' SKUs required manual forecasting involving collaboration with the retailers. Identifying the segments and implementing tailored practices was not straightforward. Case study 10.4 in Chapter 10 describes the five enablers identified by K-C Europe for the organisational change required. (Source: Dr Janet Godsell and Stuart Bailey, Brakes Group, formerly of K-C Europe, 2011) Questions 1 As mentioned, the K-C segments were particularly useful for communications between supply chain and marketing. Discuss how else they might be useful. 2 Marketing encountered difficulties implementing the tailored practices at SKU level. Discuss what the difficulties might have been. 3 What difficulties might the decoupling points in the K-C supply chain present to the implementation of the manufacturing tailored practices
Step by Step Solution
There are 3 Steps involved in it
1 Expert Approved Answer
Step: 1 Unlock

Question Has Been Solved by an Expert!
Get step-by-step solutions from verified subject matter experts
Step: 2 Unlock
Step: 3 Unlock