

Question: Case Study # 4: (5%) Global Air Transportation. Geneva - The International Air Transport Association (IATA) revealed that present trends in air transport suggest passenger
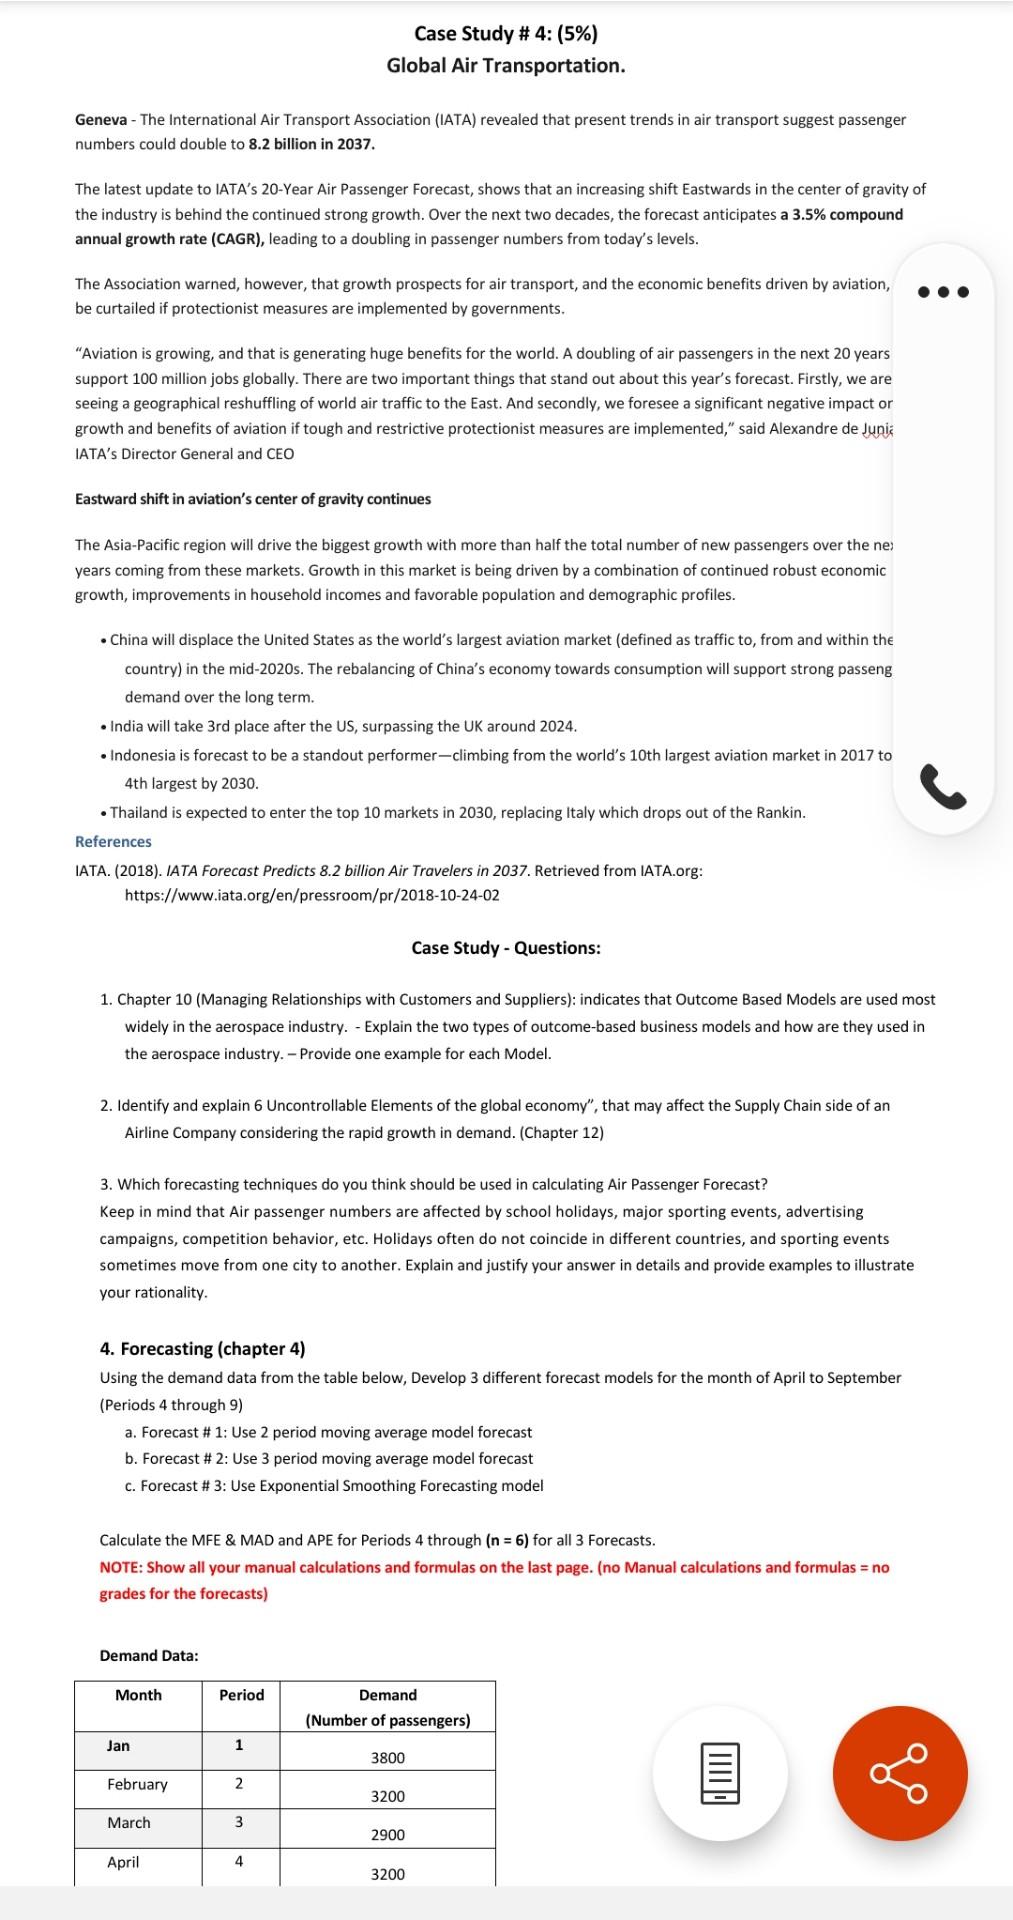
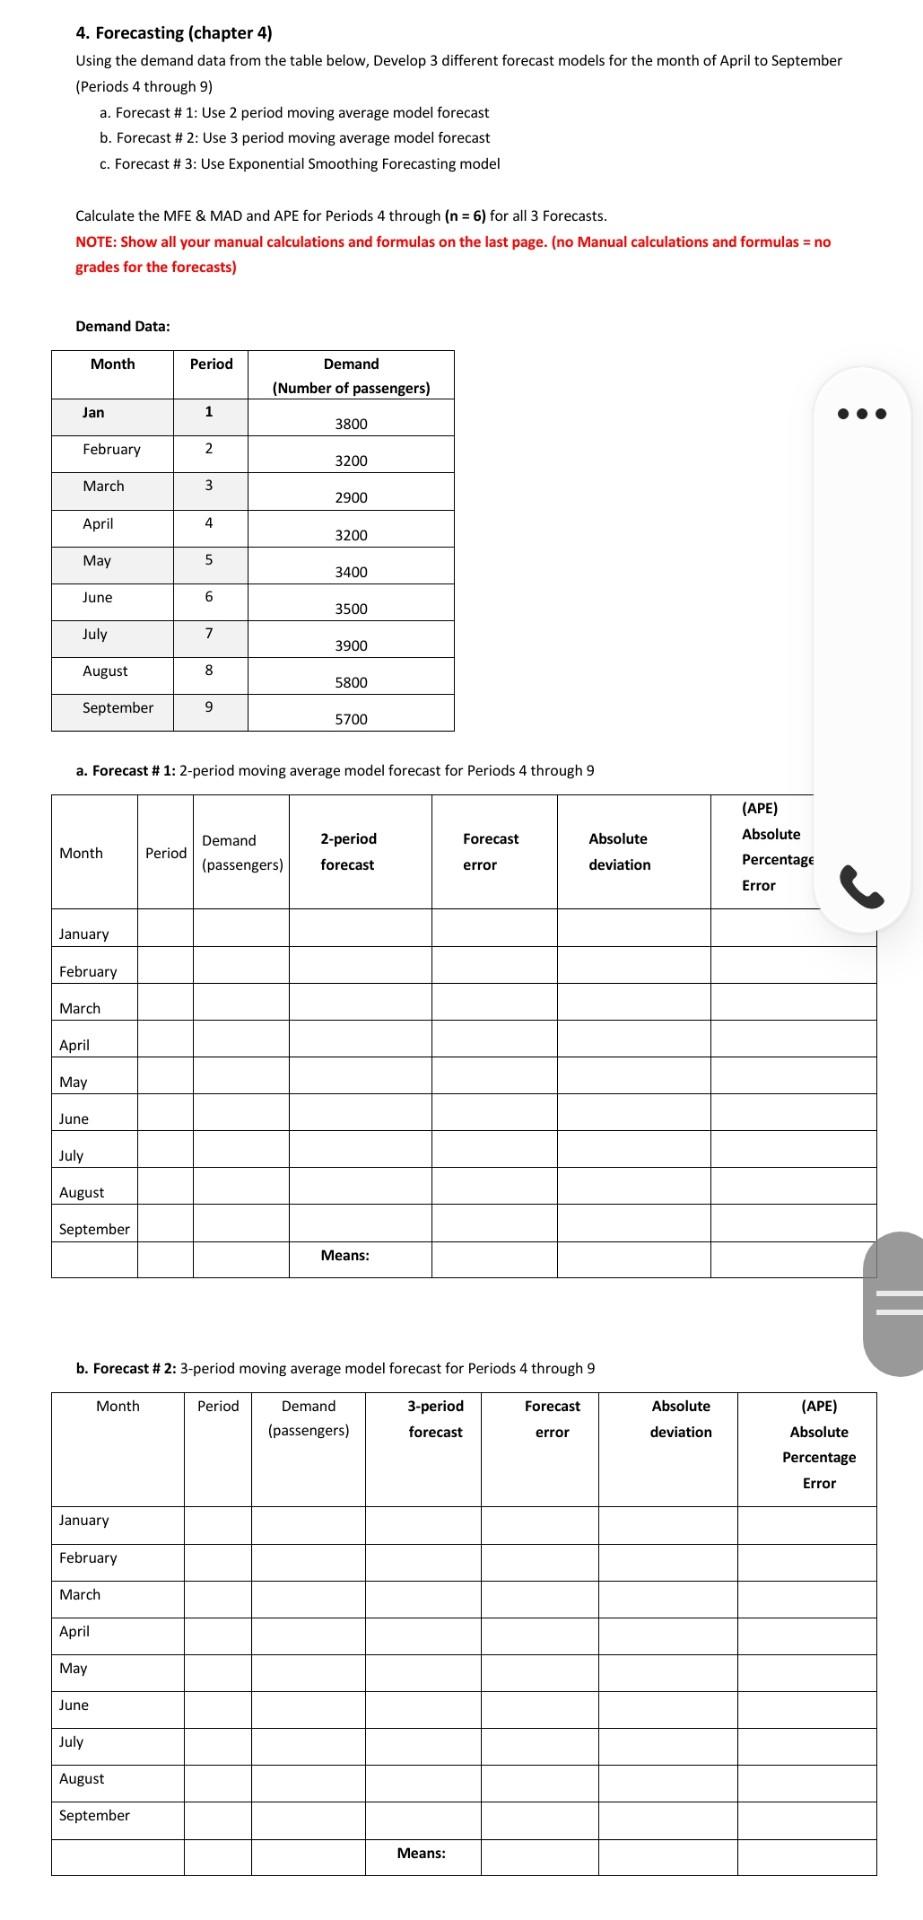
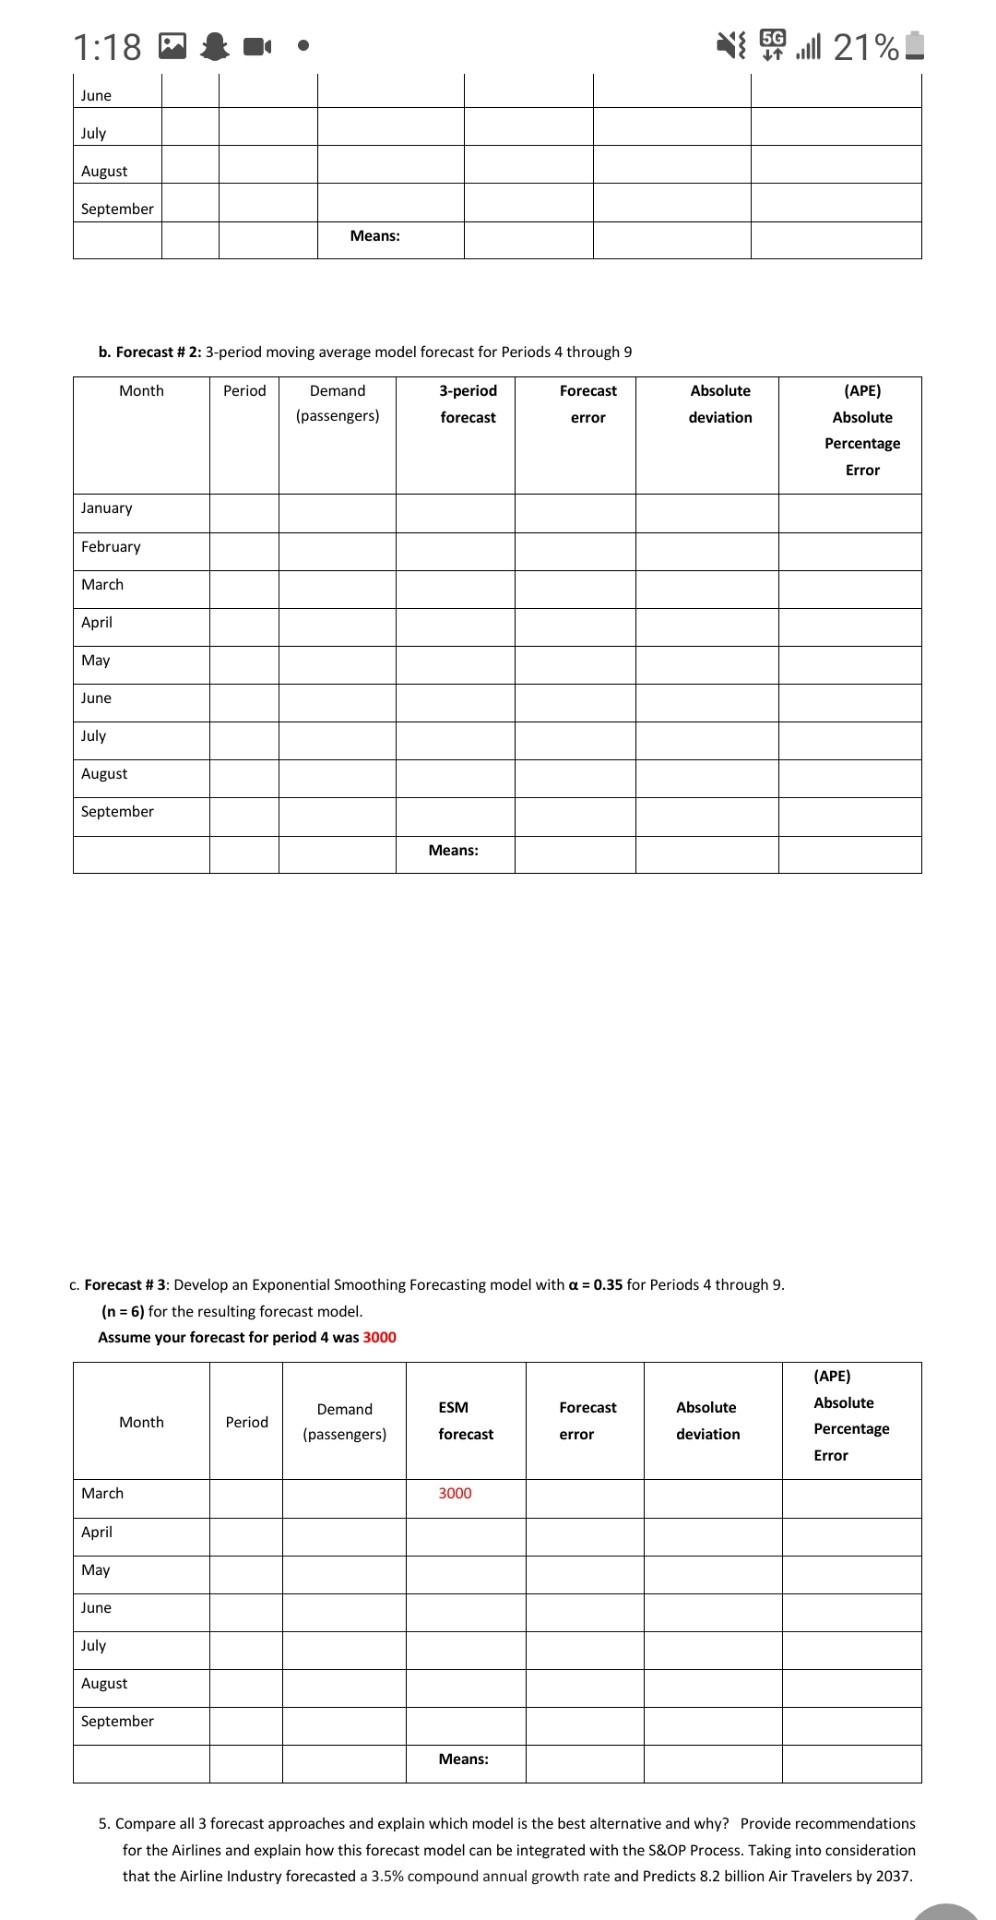
Case Study # 4: (5%) Global Air Transportation. Geneva - The International Air Transport Association (IATA) revealed that present trends in air transport suggest passenger numbers could double to 8.2 billion in 2037. The latest update to IATA's 20-Year Air Passenger Forecast, shows that an increasing shift Eastwards in the center of gravity of the industry is behind the continued strong growth. Over the next two decades, the forecast anticipates a 3.5% compound annual growth rate (CAGR), leading to a doubling in passenger numbers from today's levels. The Association warned, however, that growth prospects for air transport, and the economic benefits driven by aviation, be curtailed if protectionist measures are implemented by governments. "Aviation is growing, and that is generating huge benefits for the world. A doubling of air passengers in the next 20 years support 100 million jobs globally. There are two important things that stand out about this year's forecast. Firstly, we are seeing a geographical reshuffling of world air traffic to the East. And secondly, we foresee a significant negative impact or growth and benefits of aviation if tough and restrictive protectionist measures are implemented," said Alexandre de Junia IATA's Director General and CEO Eastward shift in aviation's center of gravity continues The Asia-Pacific region will drive the biggest growth with more than half the total number of new passengers over the ne: years coming from these markets. Growth in this market is being driven by a combination of continued robust economic growth, improvements in household incomes and favorable population and demographic profiles. China will displace the United States as the world's largest aviation market (defined as traffic to, from and within the country) in the mid-2020s. The rebalancing of China's economy towards consumption will support strong passeng demand over the long term. India will take 3rd place after the US, surpassing the UK around 2024. Indonesia is forecast to be a standout performer-climbing from the world's 10th largest aviation market in 2017 to 4th largest by 2030. Thailand is expected to enter the top 10 markets in 2030, replacing Italy which drops out of the Rankin. References IATA. (2018). IATA Forecast Predicts 8.2 billion Air Travelers in 2037. Retrieved from IATA.org: https://www.iata.org/en/pressroom/pr/2018-10-24-02 Case Study - Questions: 1. Chapter 10 (Managing Relationships with Customers and Suppliers): indicates that Outcome Based Models are used most widely in the aerospace industry. - Explain the two types of outcome-based business models and how are they used in the aerospace industry.- Provide one example for each Model. 2. Identify and explain 6 Uncontrollable Elements of the global economy", that may affect the Supply Chain side of an Airline Company considering the rapid growth in demand. (Chapter 12) 3. Which forecasting techniques do you think should be used in calculating Air Passenger Forecast? Keep in mind that Air passenger numbers are affected by school holidays, major sporting events, advertising campaigns, competition behavior, etc. Holidays often do not coincide in different countries, and sporting events sometimes move from one city to another. Explain and justify your answer in details and provide examples to illustrate your rationality. 4. Forecasting (chapter 4) Using the demand data from the table below, Develop 3 different forecast models for the month of April to September (Periods 4 through 9) a. Forecast # 1: Use 2 period moving average model forecast b. Forecast # 2: Use 3 period moving average model forecast c. Forecast # 3: Use Exponential Smoothing Forecasting model Calculate the MFE & MAD and APE for Periods 4 through (n = 6) for all 3 Forecasts. NOTE: Show all your manual calculations and formulas on the last page. (no Manual calculations and formulas = no grades for the forecasts) Demand Data: Month Period Demand (Number of passengers) Jan 1 3800 February 2 go 3200 March 3 2900 April 4 3200 4. Forecasting (chapter 4) Using the demand data from the table below, Develop 3 different forecast models for the month of April to September (Periods 4 through 9) a. Forecast # 1: Use 2 period moving average model forecast b. Forecast # 2: Use 3 period moving average model forecast c. Forecast # 3: Use Exponential Smoothing Forecasting model Calculate the MFE & MAD and APE for Periods 4 through (n = 6) for all 3 Forecasts. NOTE: Show all your manual calculations and formulas on the last page. (no Manual calculations and formulas = no grades for the forecasts) Demand Data: Month Period Demand (Number of passengers) Jan 1 3800 February 2. 3200 March 3 2900 April 4 3200 May 5 3400 June 6 3500 July 7 3900 August 8 5800 September 9 5700 a. Forecast # 1: 2-period moving average model forecast for Periods 4 through 9 Demand Forecast Absolute Month Period 2-period forecast (APE) Absolute Percentage Error (passengers) error deviation January February March April May June July August September Means: b. Forecast # 2: 3-period moving average model forecast for Periods 4 through 9 Month Period Demand Forecast Absolute 3-period forecast (APE) Absolute (passengers) error deviation Percentage Error January February March April May June July August September Means: 1:18 5G ...ll 21%. June July August September Means: b. Forecast # 2: 3-period moving average model forecast for Periods 4 through 9 Month Period Forecast Demand (passengers) 3-period forecast Absolute deviation error (APE) Absolute Percentage Error January February March April May June July August September Means: c. Forecast # 3: Develop an Exponential Smoothing Forecasting model with a = 0.35 for Periods 4 through 9. (n = 6) for the resulting forecast model. Assume your forecast for period 4 was 3000 ESM Forecast Absolute (APE) Absolute Percentage Error Month Demand (passengers) Period forecast error deviation March 3000 April May June July August September Means: 5. Compare all 3 forecast approaches and explain which model is the best alternative and why? Provide recommendations for the Airlines and explain how this forecast model can be integrated with the S&OP Process. Taking into consideration that the Airline Industry forecasted a 3.5% compound annual growth rate and Predicts 8.2 billion Air Travelers by 2037
Step by Step Solution
There are 3 Steps involved in it
1 Expert Approved Answer
Step: 1 Unlock

Question Has Been Solved by an Expert!
Get step-by-step solutions from verified subject matter experts
Step: 2 Unlock
Step: 3 Unlock