

Question: Case Study 4 Using the financial information in the following tables, compute the required ratios list on the ratio analysis sheet and then complete the
"Case Study 4
Using the financial information in the following tables, compute the required ratios list on the ratio analysis sheet and then complete the horizontal and vertical analyses worksheets. indicating whether or not if fraud may be occurring and which, if any indicators. and if you could please show with excel formulas, thank you.
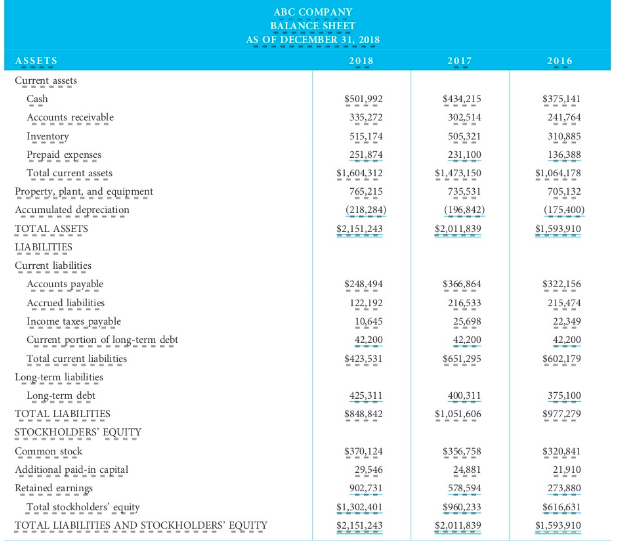
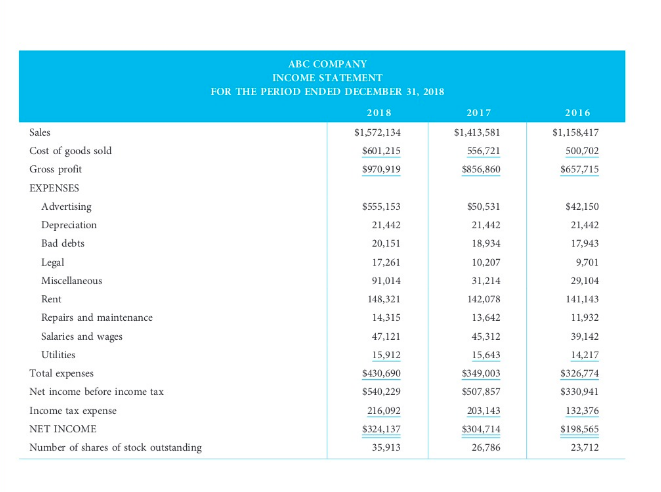
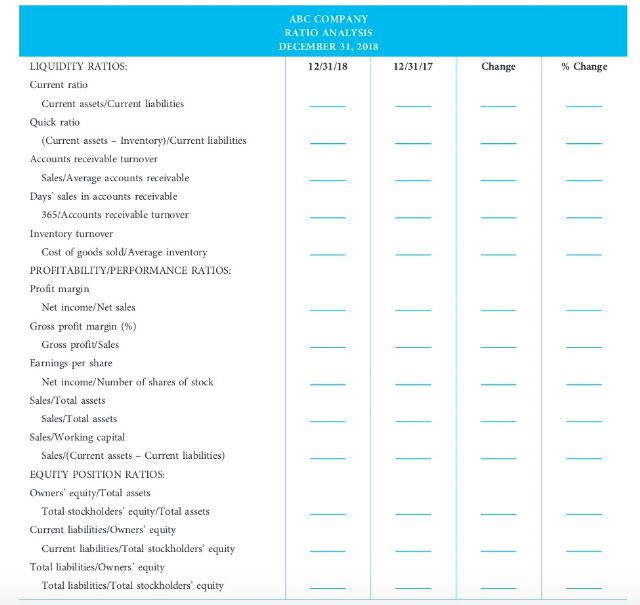
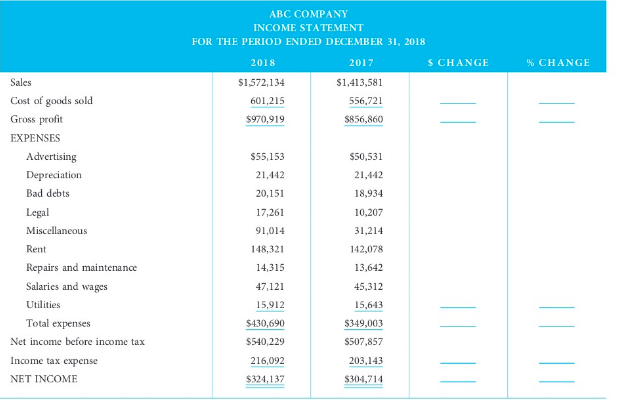
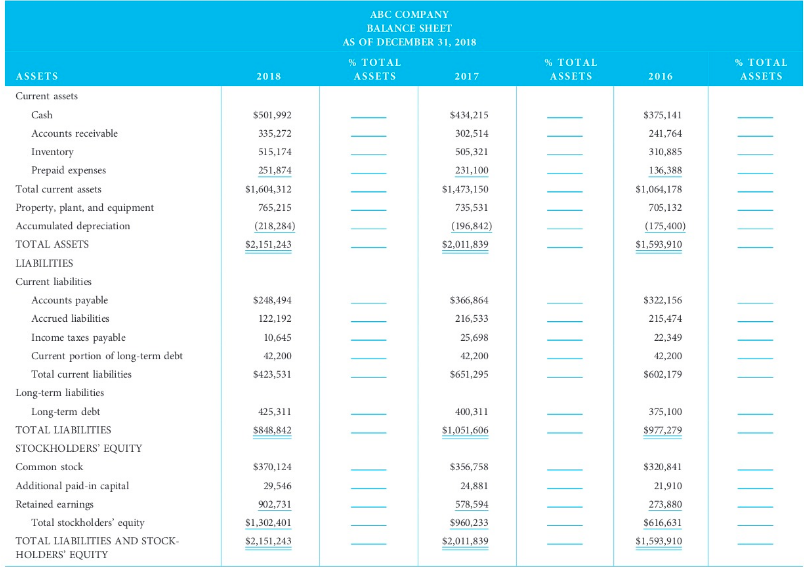
2017 2016 $434,215 $375,141 241,764 302,514 505,321 231,100 $1,173,150 735,531 (196,842) $2,011,839 310,885 136,388 $1,064,178 705,132 (175,400) $1,593910 ABC COMPANY BALANCE SHEET AS OF DECEMBER 31, 2018 ASSETS 2018 Current assets Cash S501,992 Accounts receivable 335,272 Inventory 515,174 Prepaid expenses 251,874 Total current assets $1,604,312 Property, plant, and equipment 765,215 Accumulated depreciation (218,284) TOTAL ASSETS $2,151,243 LIABILITIES Current liabilities Accounts payable $248,494 Accrued liabilities 122.192 Income taxes payable 10,645 Current portion of long-term debt 42.200 Total current liabilities $423,531 Long term liabilities Long-term debt 425,311 TOTAL LIABILITIES $848,842 STOCKHOLDERS' EQUITY Common stock $370,124 Additional paid-in capital 29,546 Retained earning 902,731 Total stockholders' equity $1,302,401 TOTAL LIABILITIES AND STOCKHOLDERS' EQUITY $2,151,243 $366,864 $322,156 215,474 216,533 22.349 25,698 42,200 42,200 $651,295 $602,179 400,311 $1,051,606 375,100 $977.279 $356,758 24,881 578,594 $960,233 $2,011,839 $320,841 21.910 273,880 $616.631 $1,593,910 ABC COMPANY INCOME STATEMENT FOR THE PERIOD ENDED DECEMBER 31, 2018 2018 $1,572,134 $601,215 5970,919 2017 $1,413,581 556,721 $856,860 2016 $1,158,417 500,702 5657,715 Sales Cost of goods sold Gross profit EXPENSES Advertising Depreciation Bad debts Legal Miscellaneous 550,531 $42,150 $555,153 21,442 20,151 21,442 18,934 21,442 17,943 9,701 17,261 10,207 31,214 Rent 91,014 148,321 14,315 142,078 29,104 141,143 11,932 13,642 Repairs and maintenance Salaries and wages Utilities Total expenses Net income before income tax Income tax expense NET INCOME Number of shares of stock outstanding 47,121 15,912 $430,690 $540,229 216,092 45,312 15,643 $349,003 39,142 14,217 $326,774 $330,941 132,376 $507,857 203,143 $304,714 26,786 $324,137 35,913 $198,565 23,712 ABC COMPANY RATIO ANALYSIS DECEMBER 31, 2018 12/31/18 12/31/17 Change % Change LIQUIDITY RATIOS: Current ratio Current assets/Current liabilities Quick ratio (Current assets - Inventory)/Current liabilities Accounts receivable turnover Sales/Average accounts receivable Days' sales in accounts receivable 365/Accounts receivable turnover Inventory turnover Cost of goods sold/ Average inventory PROFITABILITY/PERFORMANCE RATIOS: Profit margin Net income/Net sales Gross profit margin (%) Gross profit/Sales Earnings per share Net income/Number of shares of stock Sales/Total assets Sales/Total assets Sales/Working capital Sales/(Current assets - Current liabilities) EQUITY POSITION RATIOS: Owners' equity/Total assets Total stockholders' equity/Total assets Current liabilities/Owners' equity Current liabilities/Total stockholders' equity Total liabilities/Owners' equity Total liabilities/Total stockholders' cquity ABC COMPANY INCOME STATEMENT FOR THE PERIOD ENDED DECEMBER 31, 2018 2018 2017 S CHANGE $1,572,134 $1,413,581 601,215 556,721 $970,919 $856,860 % CHANGE = $55,153 21,442 20,151 17,261 $50,531 21,442 18,934 10,207 Sales Cost of goods sold Gross profit EXPENSES Advertising Depreciation Bad debts Legal Miscellaneous Rent Repairs and maintenance Salaries and wages Utilities Total expenses Net income before income tax Income tax expense NET INCOME 91,014 31,214 142,078 148,321 13,642 45,312 14,315 47,121 15,912 $430,690 $540,229 15,643 $349,003 216,092 $507,857 203,143 $304,714 $324,137 ABC COMPANY BALANCE SHEET AS OF DECEMBER 31, 2018 % TOTAL ASSETS 2017 % TOTAL ASSETS % TOTAL ASSETS 2018 2016 $375,141 $501,992 335,272 515,174 $131,215 302,514 251,874 $1,604,312 765,215 505,321 231,100 $1,473,150 735,531 (196,842) $2,011,839 241,764 310,885 136,388 $1,064,178 705,132 (218,284) (175,400) $1,593,910 $2,151,243 ASSETS Current assets Cash Accounts receivable Inventory Prepaid expenses Total current assets Property, plant, and equipment Accumulated depreciation TOTAL ASSETS LIABILITIES Current liabilitics Accounts payable Accrued liabilities Income taxes payable Current portion of long-term debt Total current liabilities Long-term liabilities Long-term debt TOTAL LIABILITIES STOCKHOLDERS' EQUITY Common stock Additional paid-in capital Retained earnings Total stockholders' equity TOTAL LIABILITIES AND STOCK HOLDERS' EQUITY $248,494 122.192 $366,864 216,533 $322,156 215,474 25,698 22,349 10,645 42,200 $423,531 42,200 $651,295 42,200 5602,179 425,311 $848,842 400,311 $1,051,606 375,100 $977,279 $370,124 $356,758 $320,841 29,546 902,731 $1,302,401 24,881 578,594 $960,233 21,910 273,880 $616,631 $2,151,243 $2,011,839 $1,593,910
Step by Step Solution
There are 3 Steps involved in it

Get step-by-step solutions from verified subject matter experts