

Question: Case Study A contractor operates a rock crusher and stores the material until needed in an adjacent stockpile area. The stockpile area is unpaved, and
Case Study
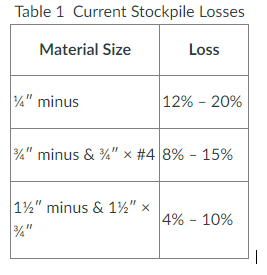
A contractor operates a rock crusher and stores the material until needed in an adjacent stockpile area. The stockpile area is unpaved, and some of the stockpiled aggregate is contaminated by the subgrade and cannot be used. The estimated stockpile losses are shown in the Table This equates to a combined loss of each year.
The contractor is considering to pave the stockpile area to reduce the loss of aggregate. Paving the stockpile area would reduce the losses due to contamination to about The crusher produces tonsyear at a cost of $ton The new paving should last years, and there has no salvage value.
The paving will cover acres. The previous stockpile losses will serve as subgrade and base courses for the new surfacing. A thick surface will require tons of asphaltic concrete, which costs $ton installed. The engineering and site work involve a onetime cost of about $ The surface requires routine maintenance costing about $year
Table shows the uncertainty lower and upper limits of the data estimated by the contractor to evaluate the feasibility of paving the stockpile area. Assuming the contractor has a minimum accepted rate of return MARR of answer the following questions the use of Microsoft Excel to solve this case study is strongly recommended. Excel charts and functions egRATEandPV can speed up your calculations, make your solution more accurate, and facilitate neater submission:
Determine the internal rate of return IRR of the stockpile area paving.
For each of the variables in Table use IRR to graph NPV vs the value of this variable, as the variable ranges between the limits you derive from the table use intervalshint: for each graph, use estimated values of the other factors, eg use values ranging between to years for the economic life on xaxis versus the NPV on the yaxis assuming average values for the other variables
Based on your answer to question which of the factors in Table is riskier for the decision about whether to pave the stockpile area? hint: examine the variance of NPV between upper and lower limits
Estimate the IRR for the worstcase and bestcase scenarios for all variables in Table hint: for the bestcase scenario assume all variables will have their best possible outcome and vice versa for the worstcase scenario
What is the NPV of the worstcase and bestcase scenarios using the contractors MARR?
Apply some other analyses, of your choice other than the ones listed above, you deem could help the contractor make their decision about paving the stockpile area.
Based on your answers to questions through what is your recommendation for paving the stockpile area? Explain your reasoning.
Table Current Stockpile Losses Table Lower and Upper Limits on Estimated Data
Step by Step Solution
There are 3 Steps involved in it
1 Expert Approved Answer
Step: 1 Unlock

Question Has Been Solved by an Expert!
Get step-by-step solutions from verified subject matter experts
Step: 2 Unlock
Step: 3 Unlock