

Question: Case Study - Disputes Ops Lead (Part 2) payments Case Study - Disputes Ops Lead (Part 2) payments Part 2 Your data set are in
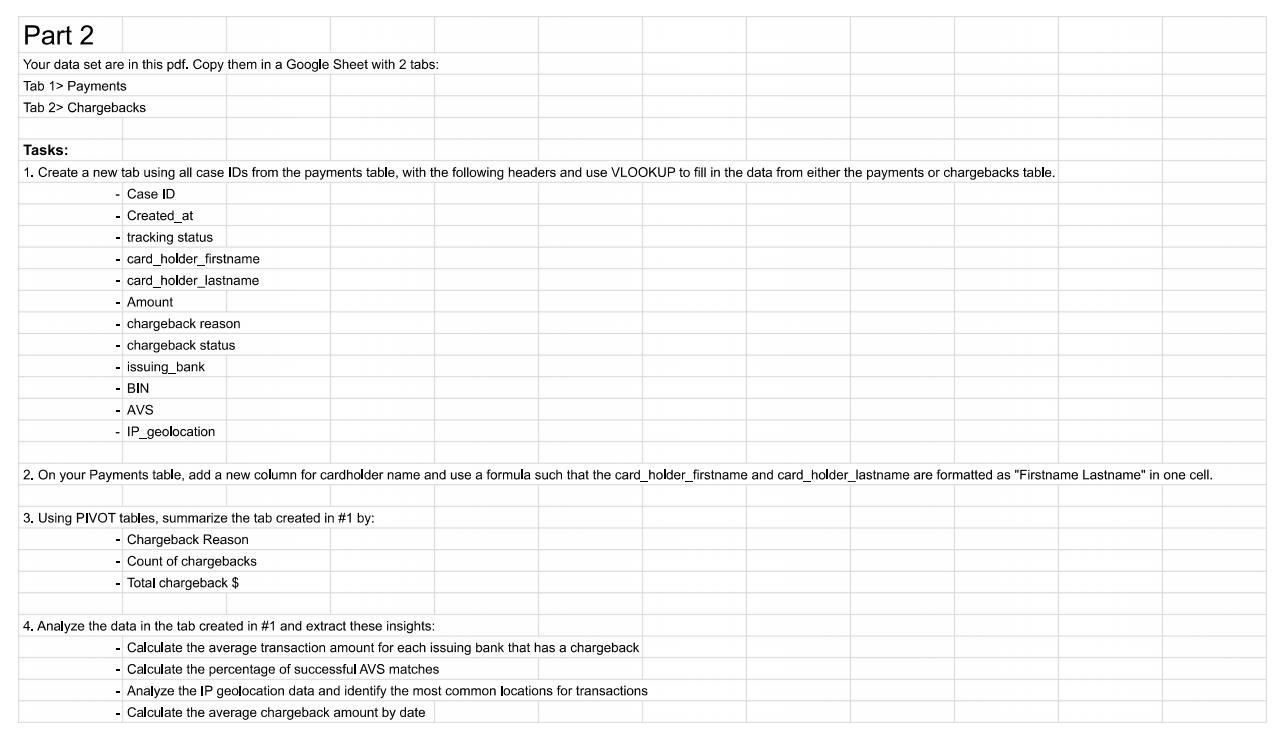
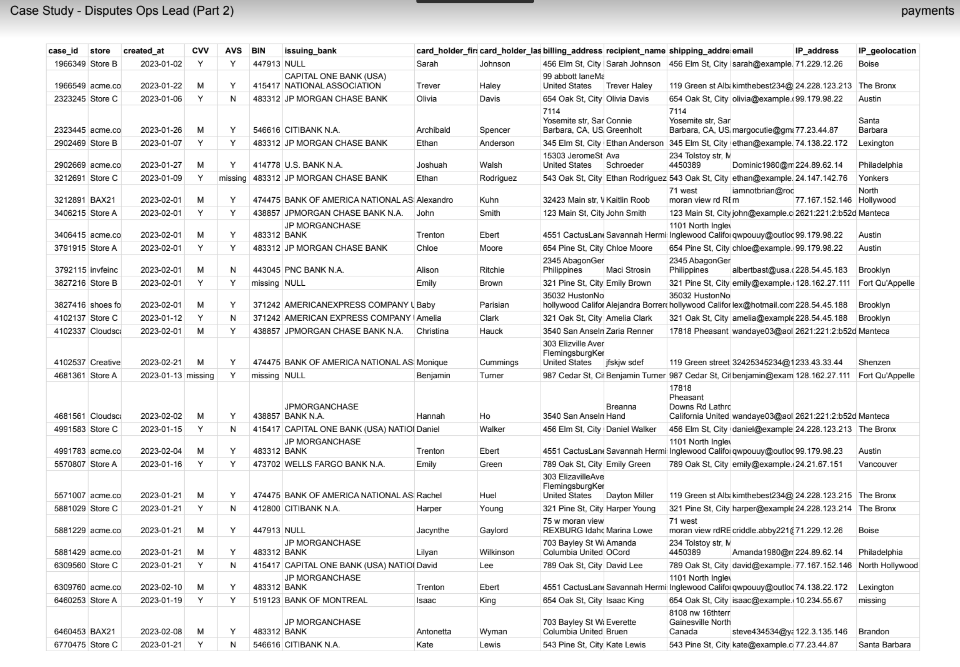
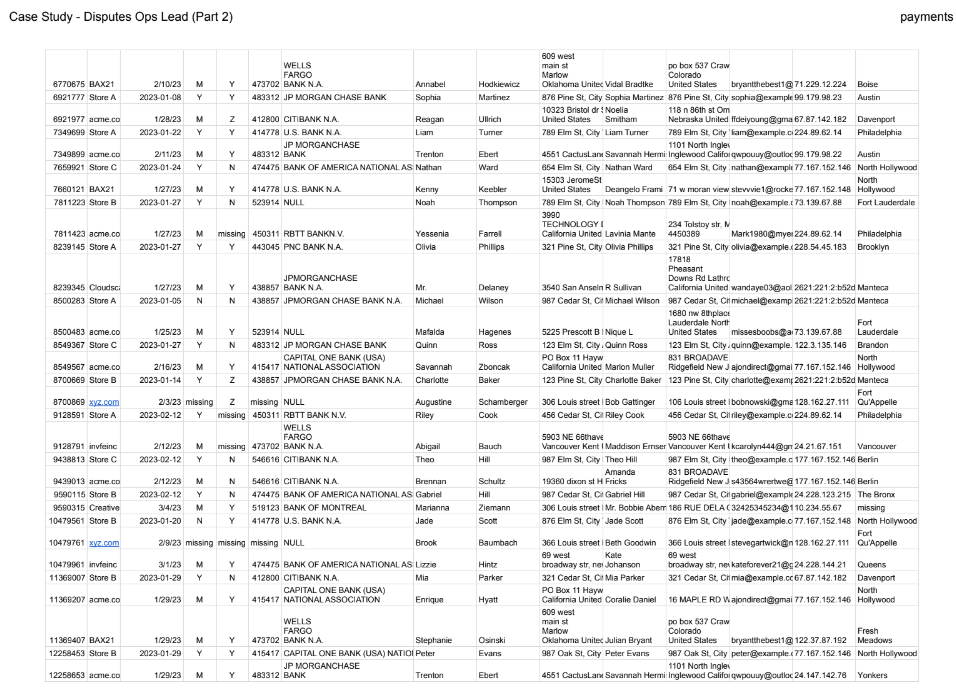
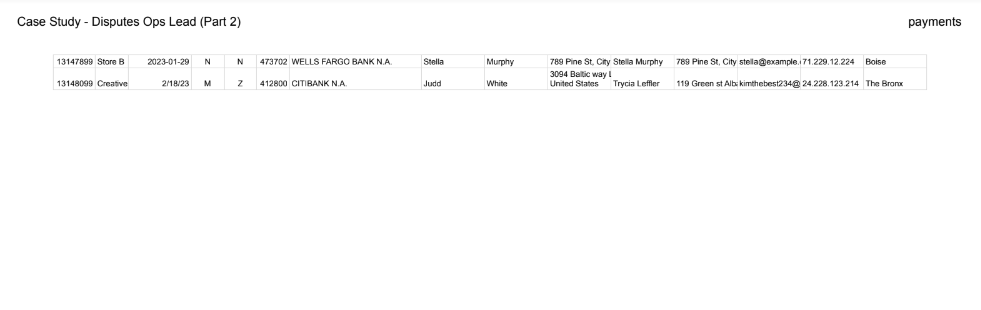
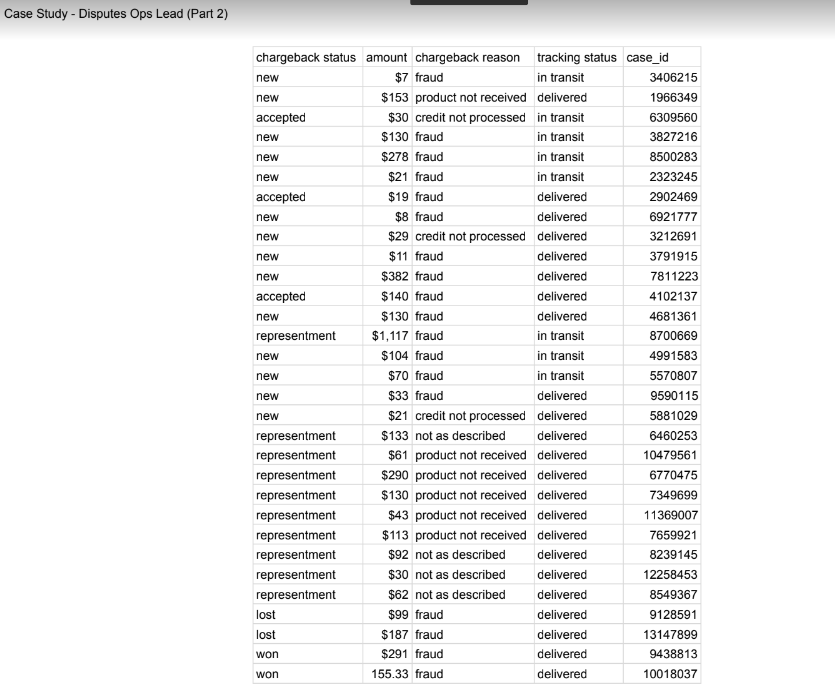
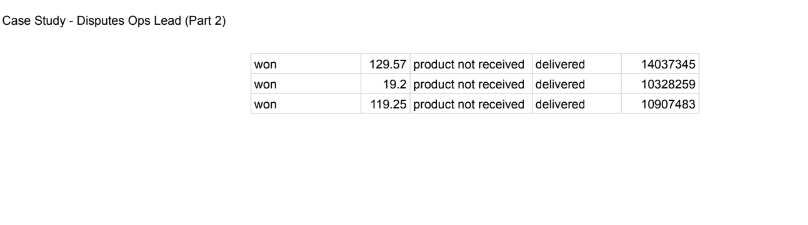
Case Study - Disputes Ops Lead (Part 2) payments Case Study - Disputes Ops Lead (Part 2) payments Part 2 Your data set are in this pdf. Copy them in a Google Sheet with 2 tabs: Tab 1> Payments Tab 2> Chargebacks Tasks: 1. Create a new tab using all case IDs from the payments table, with the following headers and use VLOOKUP to fill in the data from either the payments or chargebacks table. - Case ID - Created_at - tracking status - card_holder_firstname - card_holder_lastname - Amount - chargeback reason - chargeback status - issuing_bank - BIN - AVS - IP_geolocation 3. Using PIVOT tables, summarize the tab created in \#1 by: - Chargeback Reason - Count of chargebacks - Total chargeback \$ 4. Analyze the data in the tab created in \#1 and extract these insights: - Calculate the average transaction amount for each issuing bank that has a chargeback - Calculate the percentage of successful AVS matches - Analyze the IP geolocation data and identify the most common locations for transactions - Calculate the average chargeback amount by date Case Study - Disputes Ops Lead (Part 2) Case Study - Disputes Ops Lead (Part 2) payments Case Study - Disputes Ops Lead (Part 2) Case Study - Disputes Ops Lead (Part 2) payments Case Study - Disputes Ops Lead (Part 2) payments Part 2 Your data set are in this pdf. Copy them in a Google Sheet with 2 tabs: Tab 1> Payments Tab 2> Chargebacks Tasks: 1. Create a new tab using all case IDs from the payments table, with the following headers and use VLOOKUP to fill in the data from either the payments or chargebacks table. - Case ID - Created_at - tracking status - card_holder_firstname - card_holder_lastname - Amount - chargeback reason - chargeback status - issuing_bank - BIN - AVS - IP_geolocation 3. Using PIVOT tables, summarize the tab created in \#1 by: - Chargeback Reason - Count of chargebacks - Total chargeback \$ 4. Analyze the data in the tab created in \#1 and extract these insights: - Calculate the average transaction amount for each issuing bank that has a chargeback - Calculate the percentage of successful AVS matches - Analyze the IP geolocation data and identify the most common locations for transactions - Calculate the average chargeback amount by date Case Study - Disputes Ops Lead (Part 2) Case Study - Disputes Ops Lead (Part 2) payments Case Study - Disputes Ops Lead (Part 2)
Step by Step Solution
There are 3 Steps involved in it

Get step-by-step solutions from verified subject matter experts