

Question: Income Statement in US $ Sales Cost of Goods Sold 2019 55,000,000 37,185,000 8,250,000 3,857,000 5,708,000 1,732,000 Taxable Income 3,976,000 1,113,000 Net Income 2,863,000
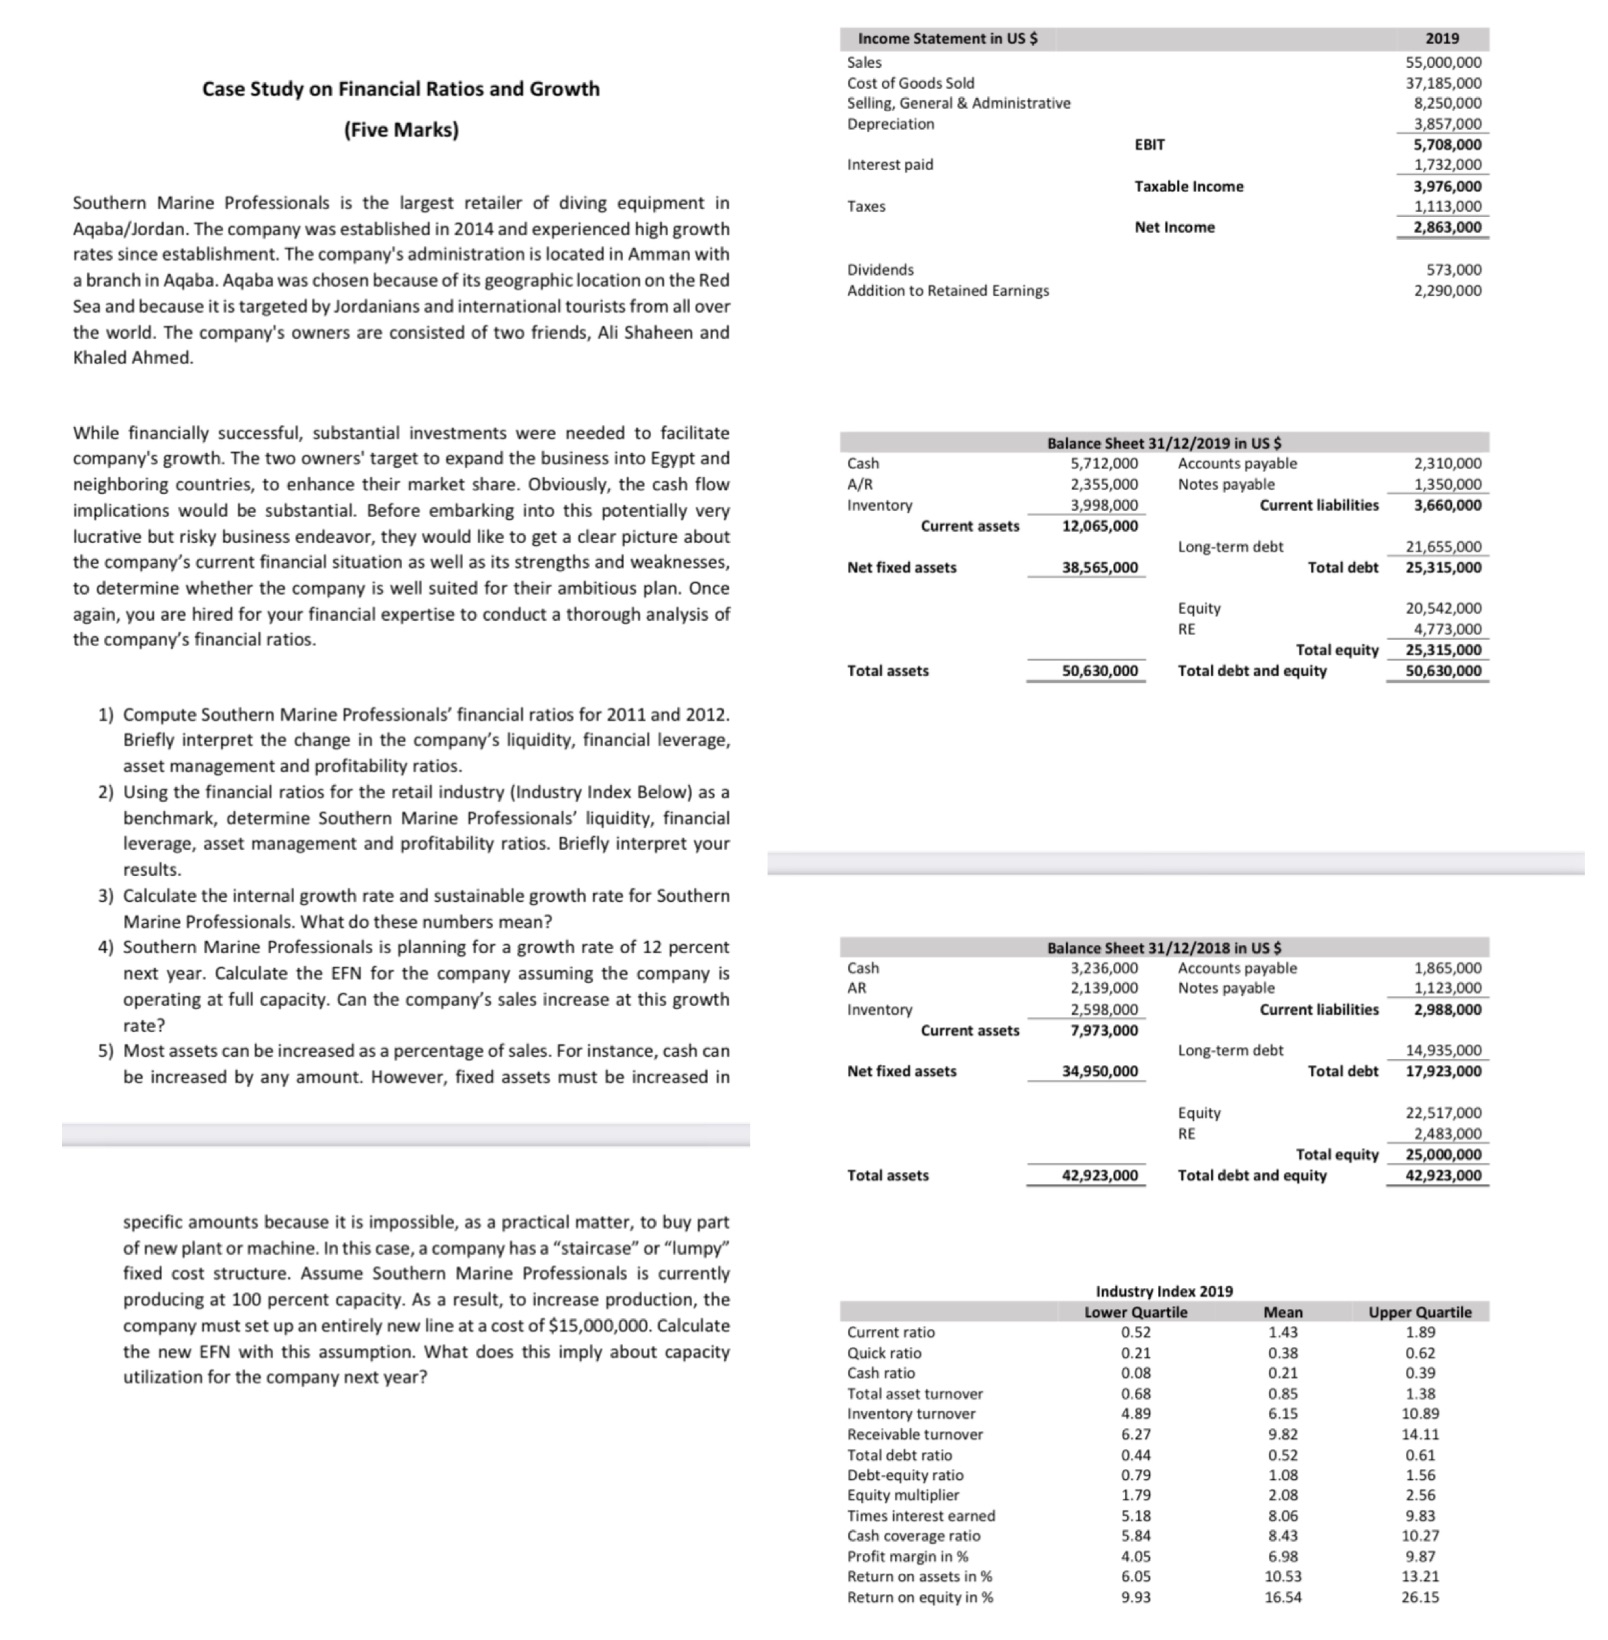
Income Statement in US $ Sales Cost of Goods Sold 2019 55,000,000 37,185,000 8,250,000 3,857,000 5,708,000 1,732,000 Taxable Income 3,976,000 1,113,000 Net Income 2,863,000 573,000 Case Study on Financial Ratios and Growth (Five Marks) Southern Marine Professionals is the largest retailer of diving equipment in Aqaba/Jordan. The company was established in 2014 and experienced high growth rates since establishment. The company's administration is located in Amman with a branch in Aqaba. Aqaba was chosen because of its geographic location on the Red Sea and because it is targeted by Jordanians and international tourists from all over the world. The company's owners are consisted of two friends, Ali Shaheen and Khaled Ahmed. Selling, General & Administrative EBIT Depreciation Interest paid Taxes Dividends Addition to Retained Earnings While financially successful, substantial investments were needed to facilitate company's growth. The two owners' target to expand the business into Egypt and neighboring countries, to enhance their market share. Obviously, the cash flow implications would be substantial. Before embarking into this potentially very lucrative but risky business endeavor, they would like to get a clear picture about the company's current financial situation as well as its strengths and weaknesses, to determine whether the company is well suited for their ambitious plan. Once again, you are hired for your financial expertise to conduct a thorough analysis of the company's financial ratios. Cash A/R Net fixed assets Balance Sheet 31/12/2019 in US $ 2,290,000 5,712,000 Accounts payable 2,355,000 Notes payable 2,310,000 1,350,000 Inventory 3,998,000 Current liabilities 3,660,000 Current assets 12,065,000 Long-term debt 21,655,000 38,565,000 Total debt 25,315,000 Equity RE 20,542,000 4,773,000 Total equity 25,315,000 50,630,000 Total debt and equity 50,630,000 1) Compute Southern Marine Professionals' financial ratios for 2011 and 2012. Briefly interpret the change in the company's liquidity, financial leverage, asset management and profitability ratios. 2) Using the financial ratios for the retail industry (Industry Index Below) as a benchmark, determine Southern Marine Professionals' liquidity, financial leverage, asset management and profitability ratios. Briefly interpret your results. 3) Calculate the internal growth rate and sustainable growth rate for Southern Marine Professionals. What do these numbers mean? 4) Southern Marine Professionals is planning for a growth rate of 12 percent next year. Calculate the EFN for the company assuming the company is operating at full capacity. Can the company's sales increase at this growth rate? 5) Most assets can be increased as a percentage of sales. For instance, cash can be increased by any amount. However, fixed assets must be increased in Total assets Cash AR Net fixed assets Balance Sheet 31/12/2018 in US $ Inventory Current assets 3,236,000 2,139,000 2,598,000 7,973,000 Accounts payable Notes payable 1,865,000 1,123,000 Current liabilities 2,988,000 Long-term debt 34,950,000 Total debt 14,935,000 17,923,000 Equity RE 22,517,000 2,483,000 Total equity 25,000,000 Total assets 42,923,000 Total debt and equity 42,923,000 specific amounts because it is impossible, as a practical matter, to buy part of new plant or machine. In this case, a company has a "staircase" or "lumpy" fixed cost structure. Assume Southern Marine Professionals is currently producing at 100 percent capacity. As a result, to increase production, the company must set up an entirely new line at a cost of $15,000,000. Calculate the new EFN with this assumption. What does this imply about capacity utilization for the company next year? Current ratio Quick ratio Industry Index 2019 Lower Quartile Mean Upper Quartile 0.52 1.43 1.89 0.21 0.38 0.62 Cash ratio 0.08 0.21 0.39 Total asset turnover 0.68 0.85 1.38 Inventory turnover 4.89 6.15 10.89 Receivable turnover 6.27 9.82 14.11 Total debt ratio 0.44 0.52 0.61 Debt-equity ratio 0.79 1.08 1.56 Equity multiplier 1.79 2.08 2.56 Times interest earned 5.18 8.06 9.83 Cash coverage ratio 5.84 8.43 10.27 Profit margin in % 4.05 6.98 9.87 Return on assets in % 6.05 10.53 13.21 Return on equity in % 9.93 16.54 26.15
Step by Step Solution
3.33 Rating (150 Votes )
There are 3 Steps involved in it
Financial Ratios Analysis for Southern Marine Professionals 1 Financial Ratios for 2019 and 2018 Liquidity Ratios Current Ratio 2019 Current Ratio Cur... View full answer

Get step-by-step solutions from verified subject matter experts