

Question: CASE STUDY ON TIME SERIES AND DECISION MATRIX Question 2 A sales outlet has been in operating in same location for the past four years.
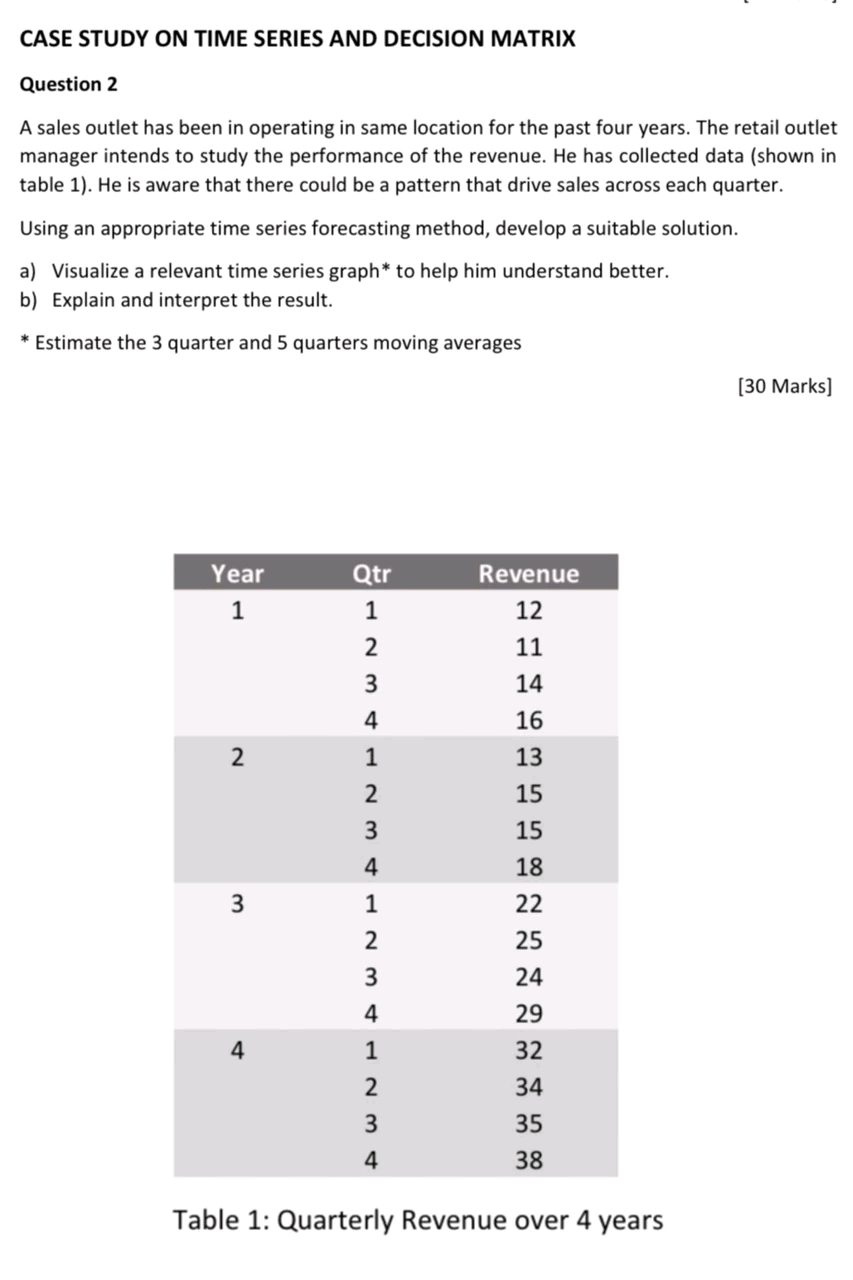
CASE STUDY ON TIME SERIES AND DECISION MATRIX Question 2 A sales outlet has been in operating in same location for the past four years. The retail outlet manager intends to study the performance of the revenue. He has collected data (shown in table 1). He is aware that there could be a pattern that drive sales across each quarter. Using an appropriate time series forecasting method, develop a suitable solution. a) Visualize a relevant time series graph* to help him understand better. b) Explain and interpret the result. * Estimate the 3 quarter and 5 quarters moving averages [30 Marks] \\(-E g Qtr Revenue 12 11 14 16 13 15 15 18 22 25 24 29 32 34 35 38 W N B B WNREDSB WNRELDBWN R I Table 1: Quarterly Revenue over 4 years
Step by Step Solution
There are 3 Steps involved in it

Get step-by-step solutions from verified subject matter experts