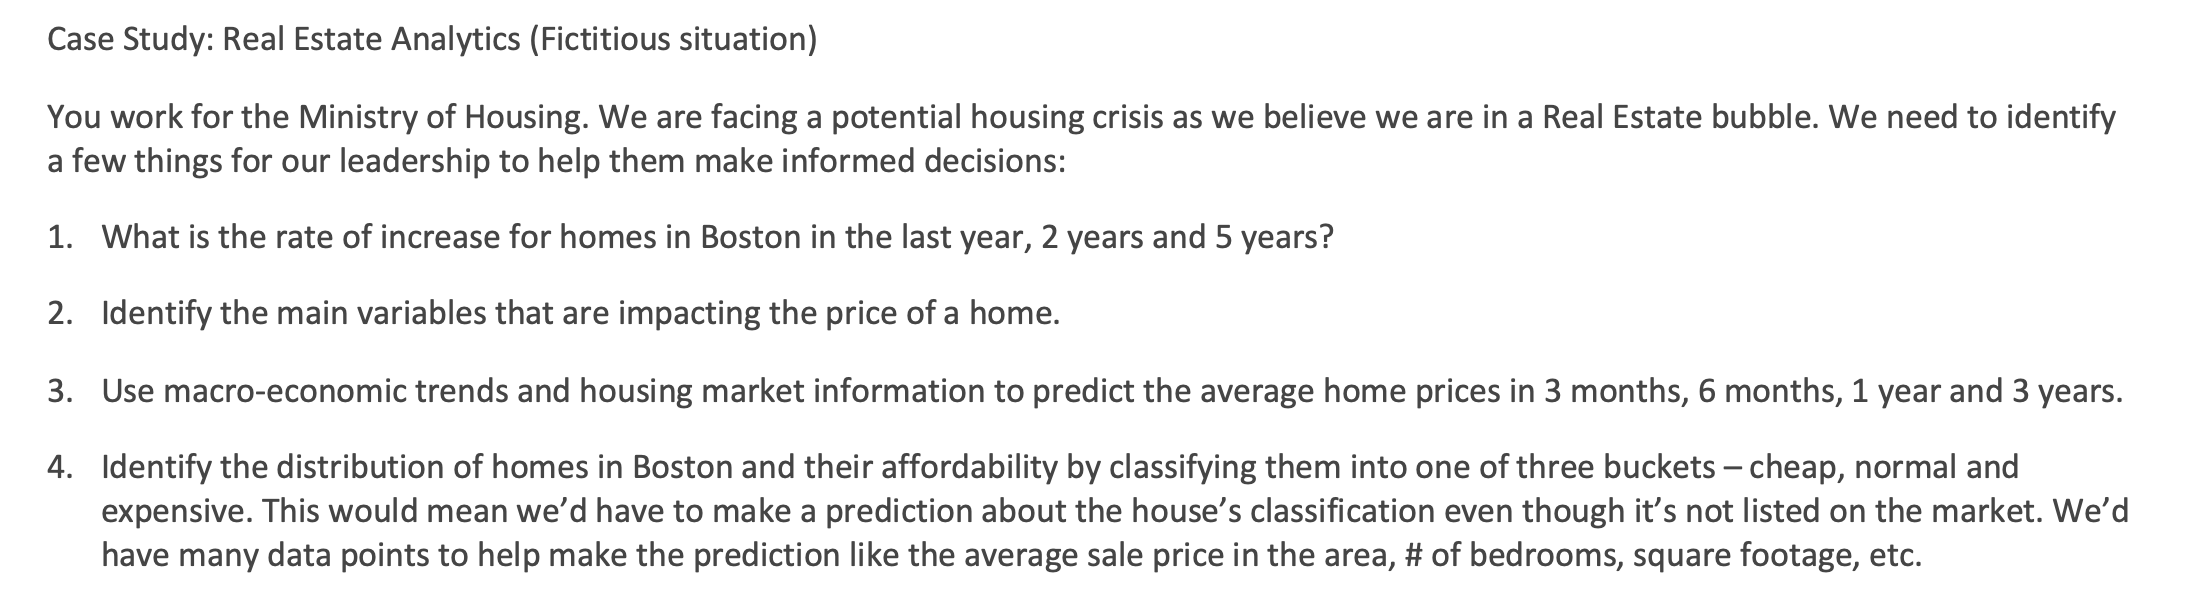
Question: Case Study: Real Estate Analytics (Fictitious situation) You work for the Ministry of Housing. We are facing a potential housing crisis as we believe we

Case Study: Real Estate Analytics (FictitiousCase Study: Real Estate Analytics (FictitiousCase Study: Real Estate Analytics (Fictitious

Case Study: Real Estate Analytics (Fictitious situation) You work for the Ministry of Housing. We are facing a potential housing crisis as we believe we are in a Real Estate bubble. We need to identify a few things for our leadership to help them make informed decisions: 1. What is the rate of increase for homes in Boston in the last year, 2 years and 5 years? 2. Identify the main variables that are impacting the price of a home. 3. Use macro-economic trends and housing market information to predict the average home prices in 3 months, 6 months, 1 year and 3 years. 4. Identify the distribution of homes in Boston and their affordability by classifying them into one of three buckets - cheap, normal and expensive. This would mean we'd have to make a prediction about the house's classification even though it's not listed on the market. We'd have many data points to help make the prediction like the average sale price in the area, \# of bedrooms, square footage, etc. 1. For each question we need to answer (above), identify the scope for the effort. Leverage the chart below as a reference and fill in the second chart with your answers. (4 marks) Fill in this chart with the scope. Case Study: Real Estate Analytics (Fictitious situation) You work for the Ministry of Housing. We are facing a potential housing crisis as we believe we are in a Real Estate bubble. We need to identify a few things for our leadership to help them make informed decisions: 1. What is the rate of increase for homes in Boston in the last year, 2 years and 5 years? 2. Identify the main variables that are impacting the price of a home. 3. Use macro-economic trends and housing market information to predict the average home prices in 3 months, 6 months, 1 year and 3 years. 4. Identify the distribution of homes in Boston and their affordability by classifying them into one of three buckets - cheap, normal and expensive. This would mean we'd have to make a prediction about the house's classification even though it's not listed on the market. We'd have many data points to help make the prediction like the average sale price in the area, \# of bedrooms, square footage, etc. 1. For each question we need to answer (above), identify the scope for the effort. Leverage the chart below as a reference and fill in the second chart with your answers. (4 marks) Fill in this chart with the scope

Step by Step Solution

There are 3 Steps involved in it

1 Expert Approved Answer
Step: 1 Unlock blur-text-image
Question Has Been Solved by an Expert!

Get step-by-step solutions from verified subject matter experts

Step: 2 Unlock
Step: 3 Unlock

Students Have Also Explored These Related General Management Questions!