

Question: Case Study Report: A community case study (attached images) has been compiled by using the data sourced from the Australian Bureau of Statistics and Myschool
Case Study Report: A community case study (attached images) has been compiled by using the data sourced from the Australian Bureau of Statistics and Myschool websites, including local government area statistics about education and employment, and NAPLAN results for one local primary and one local secondary school. Analyse the data provided by applying what you have learned about numeracy and social justice. a. What do you notice? Make statistical statements. b. What do you wonder about? What educational challenges and opportunities does the data suggest? (Aim for 900 words).
also use the references in APA7 referencing style .
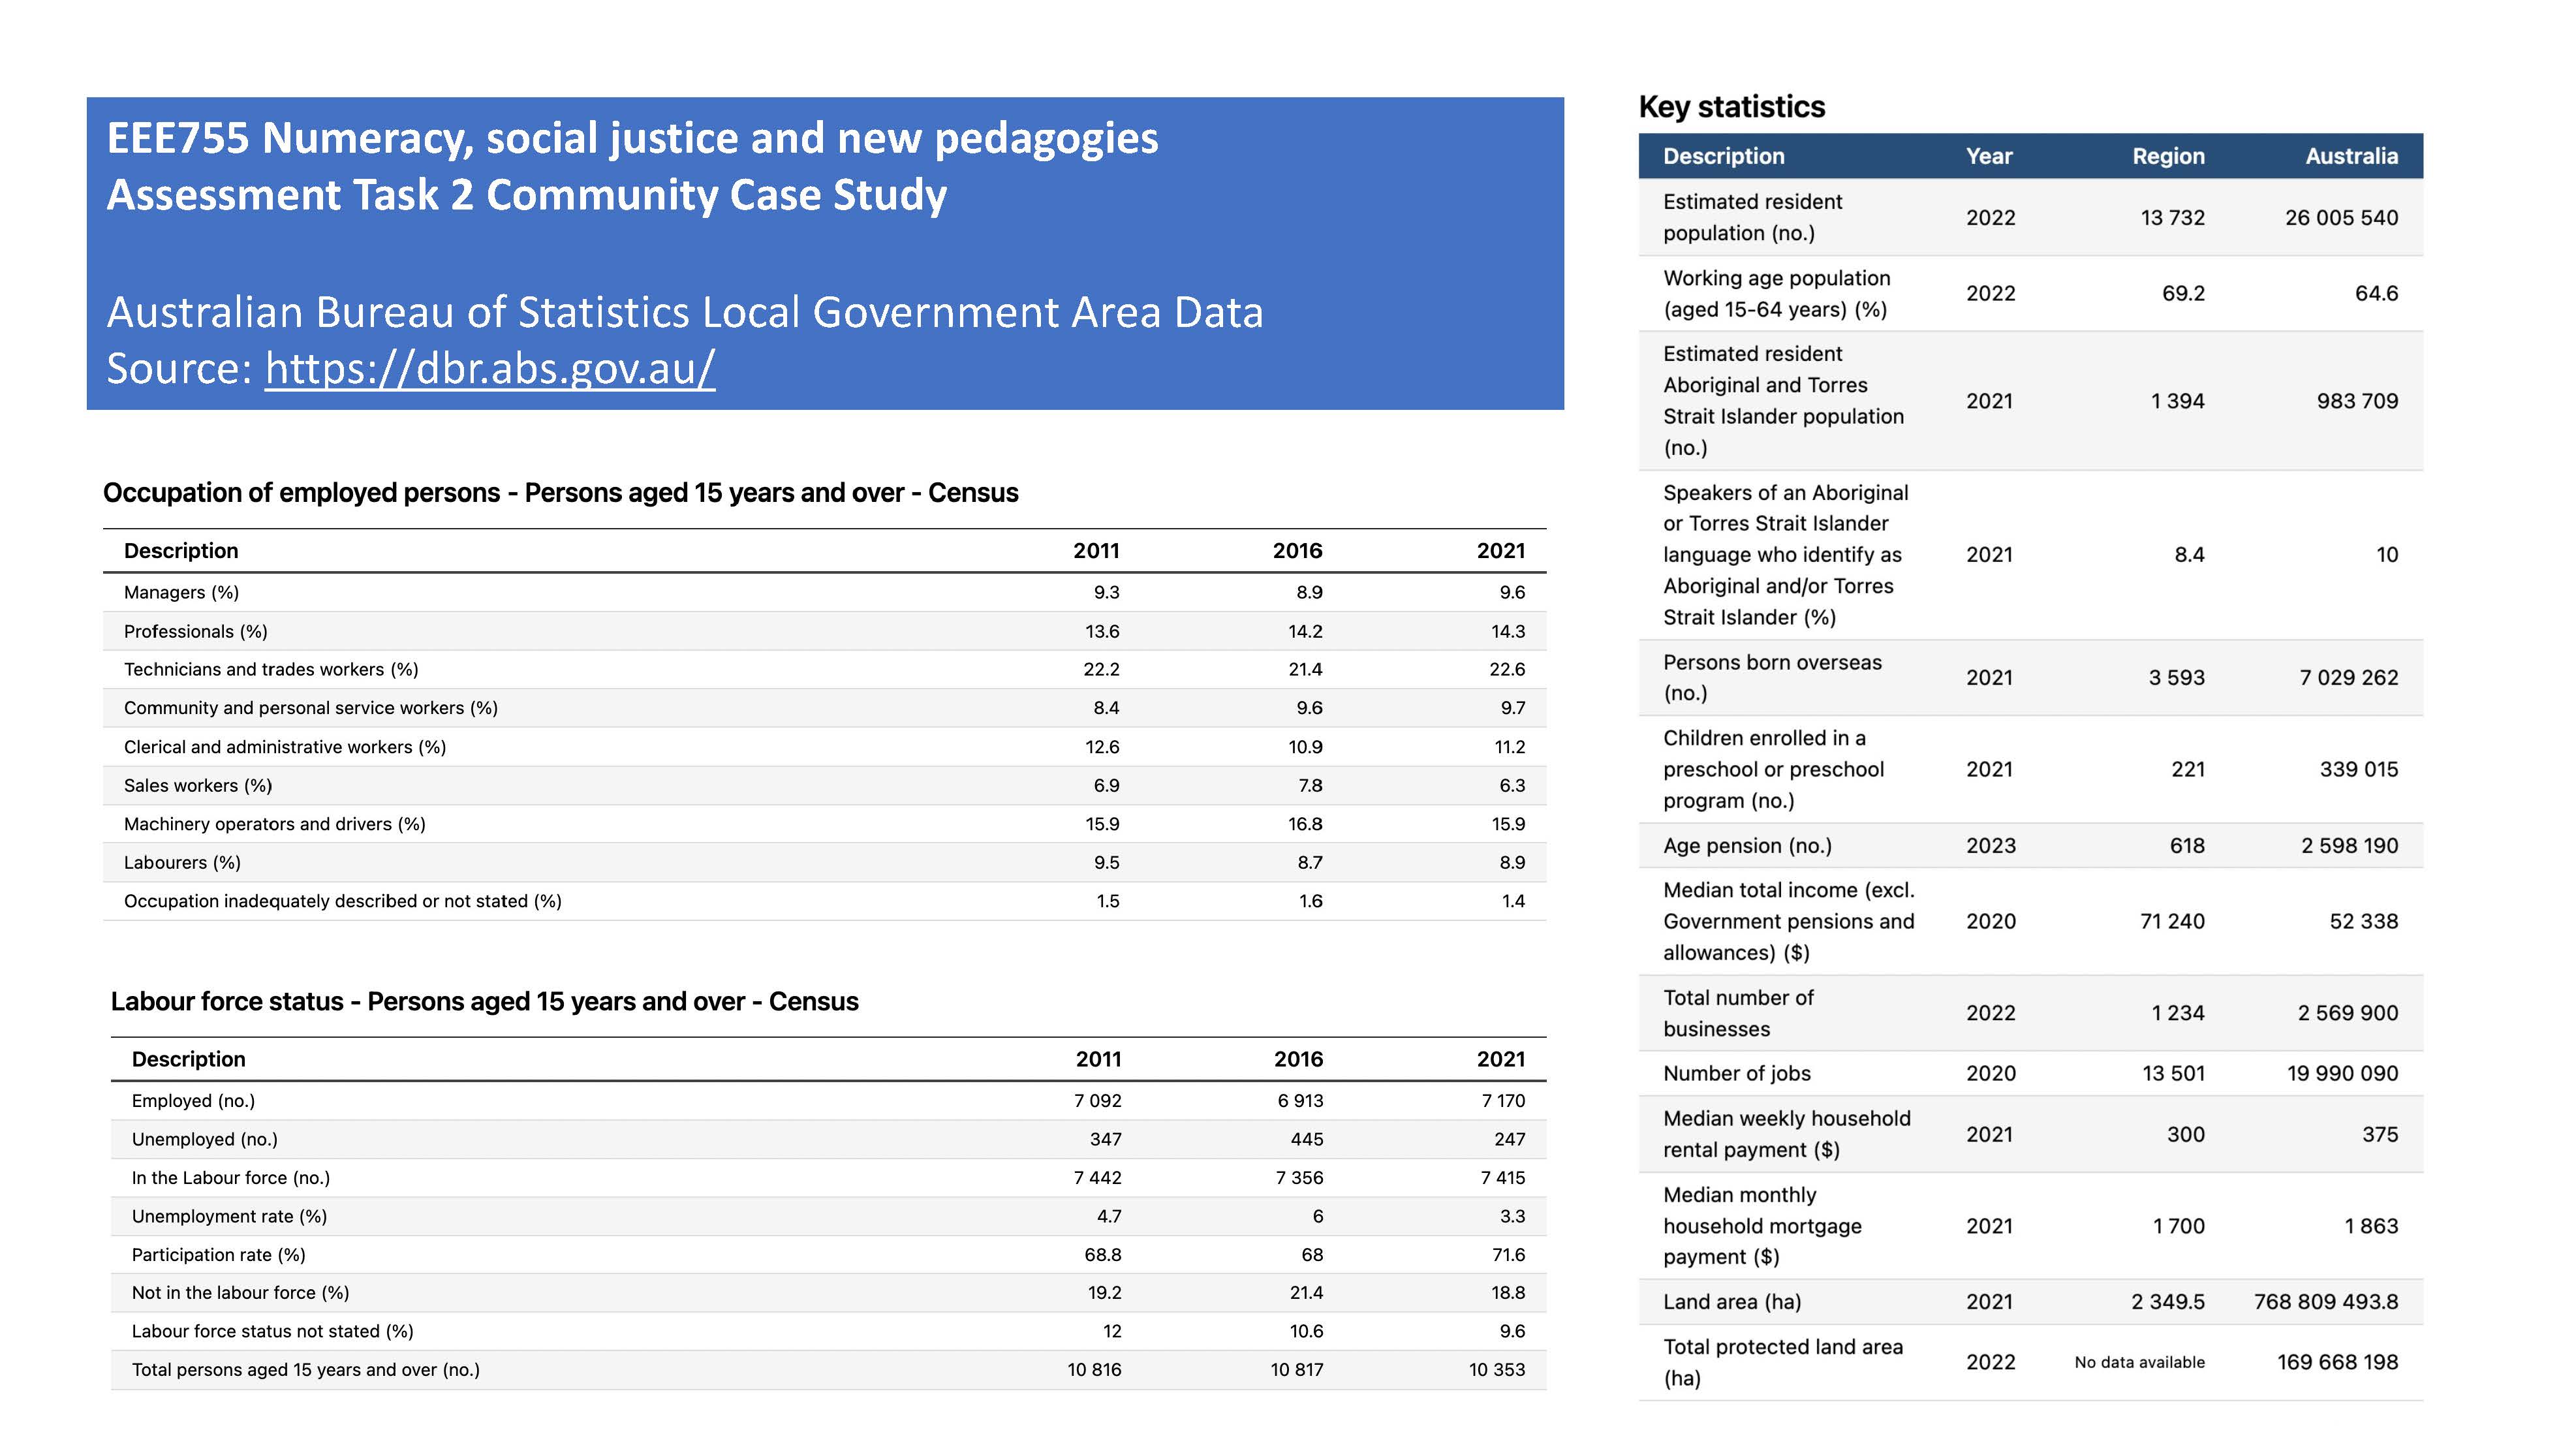
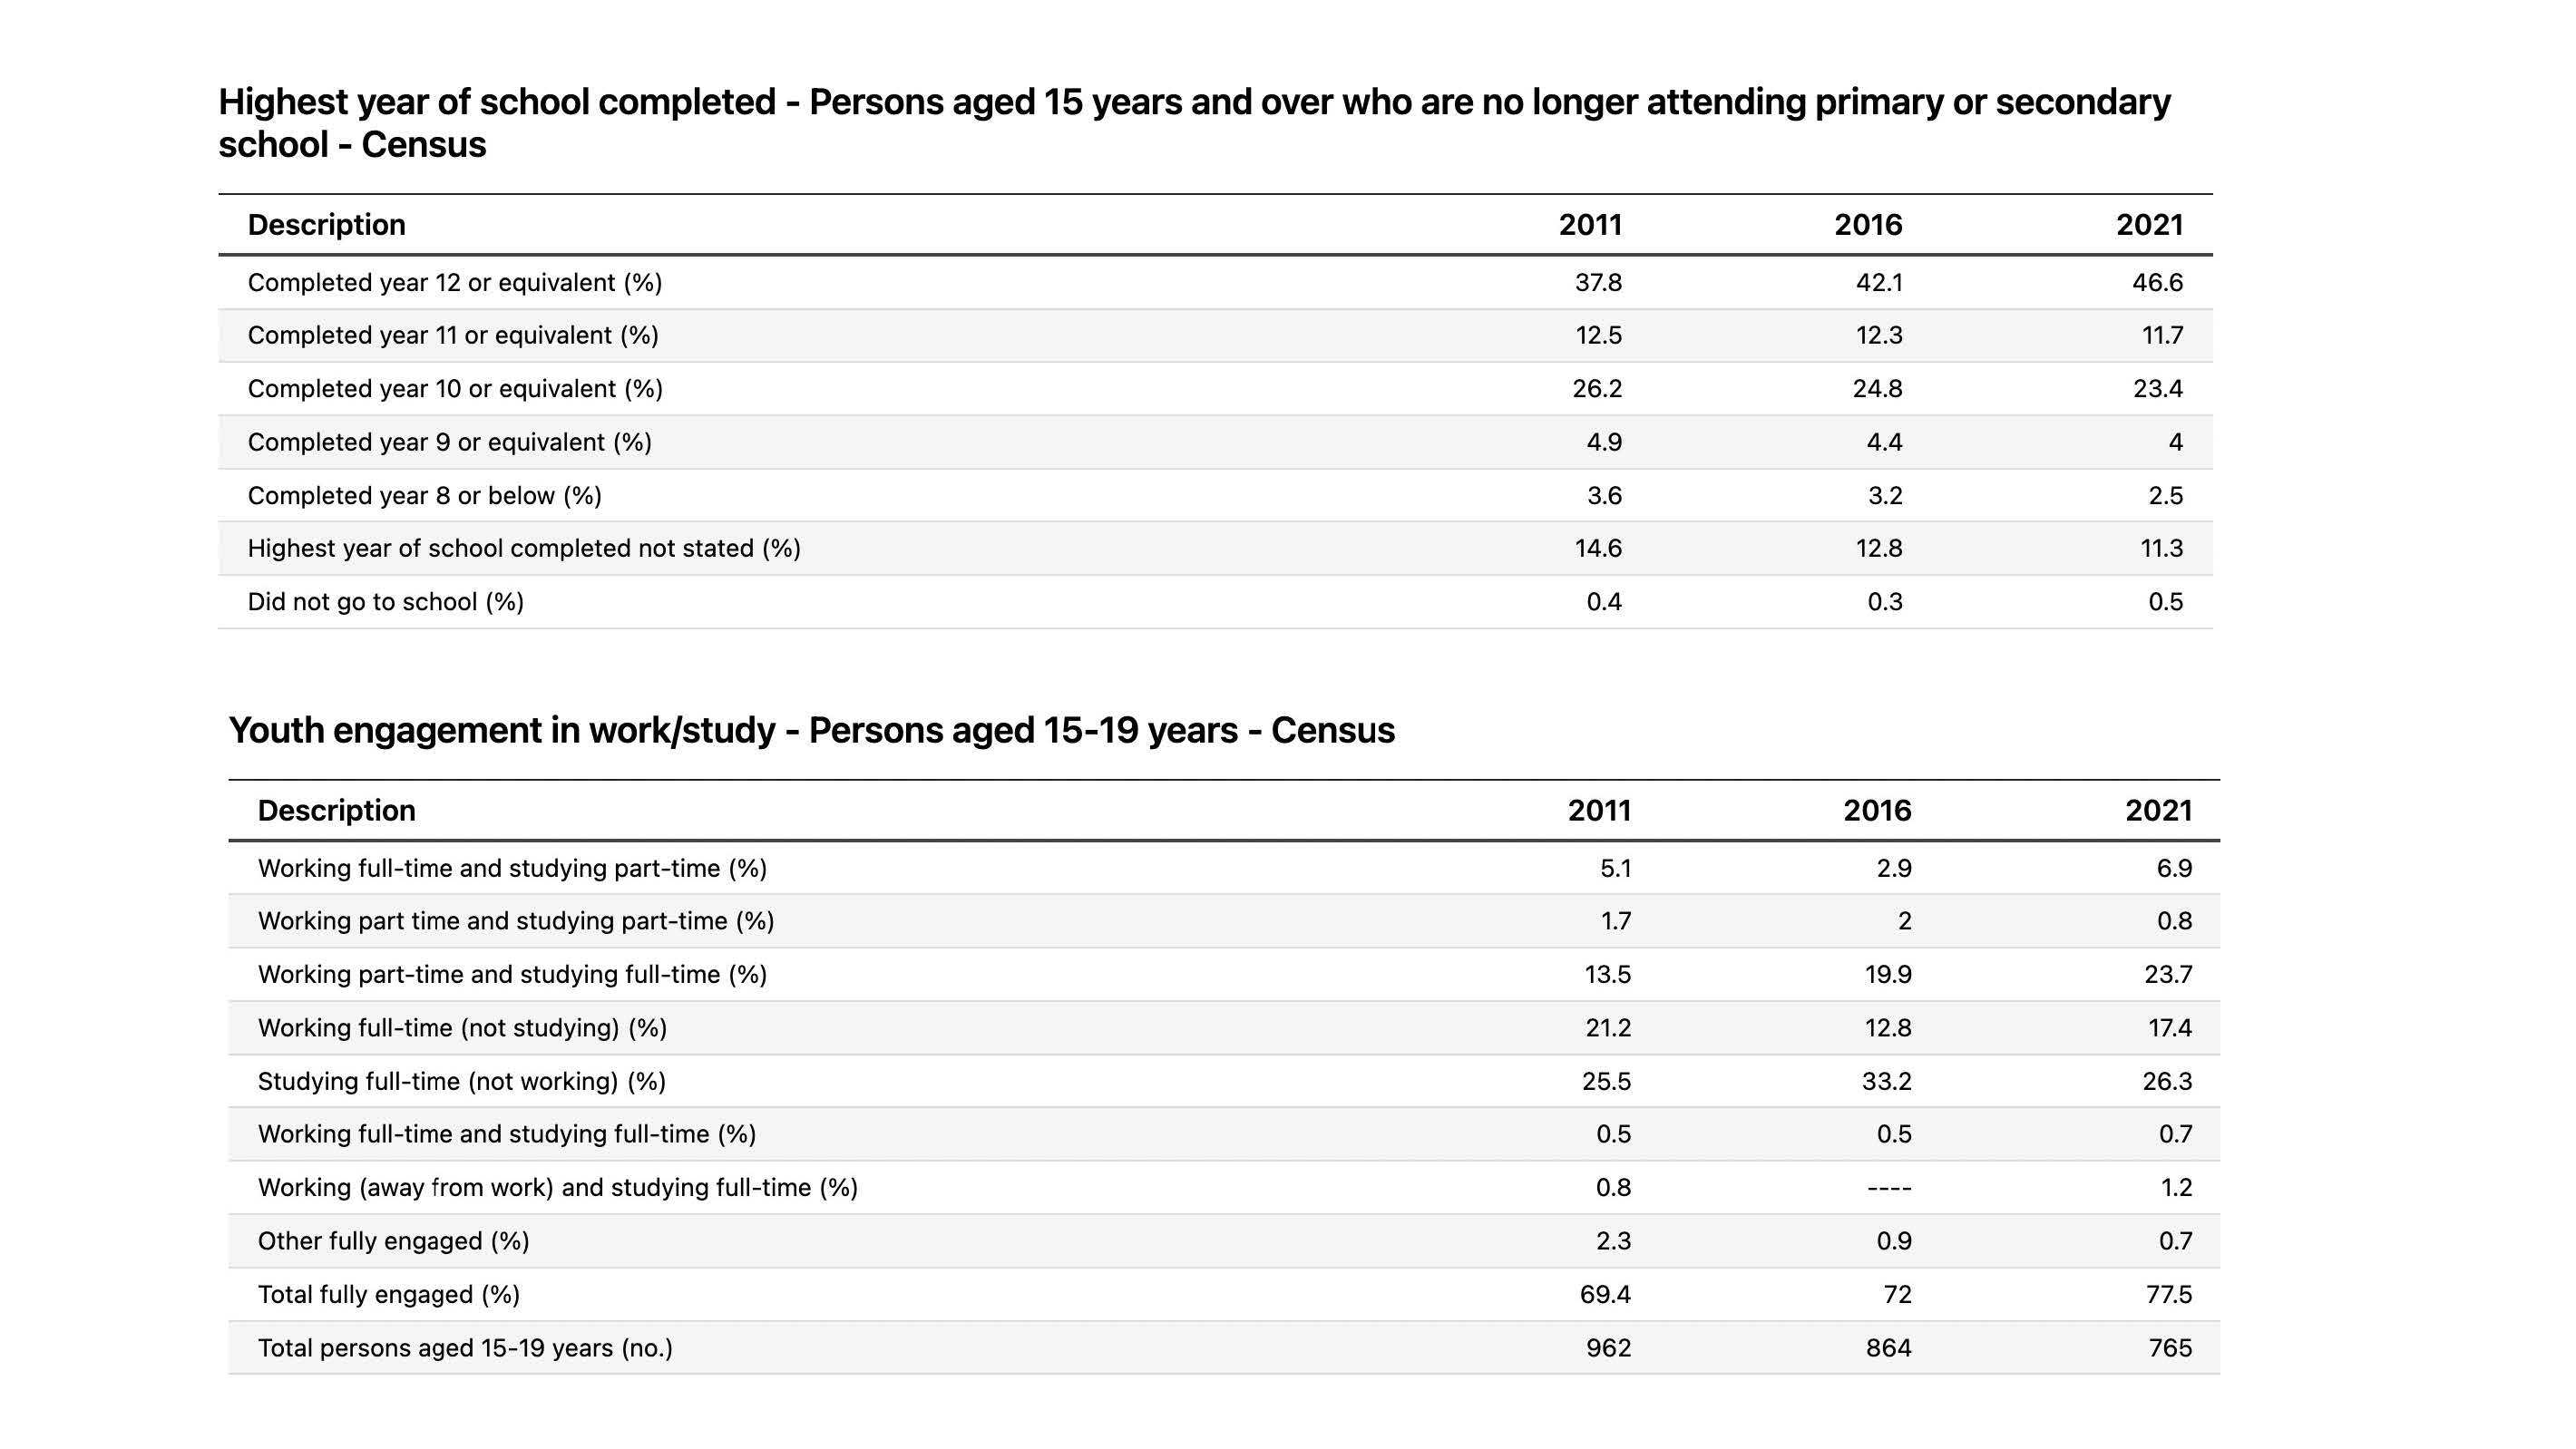
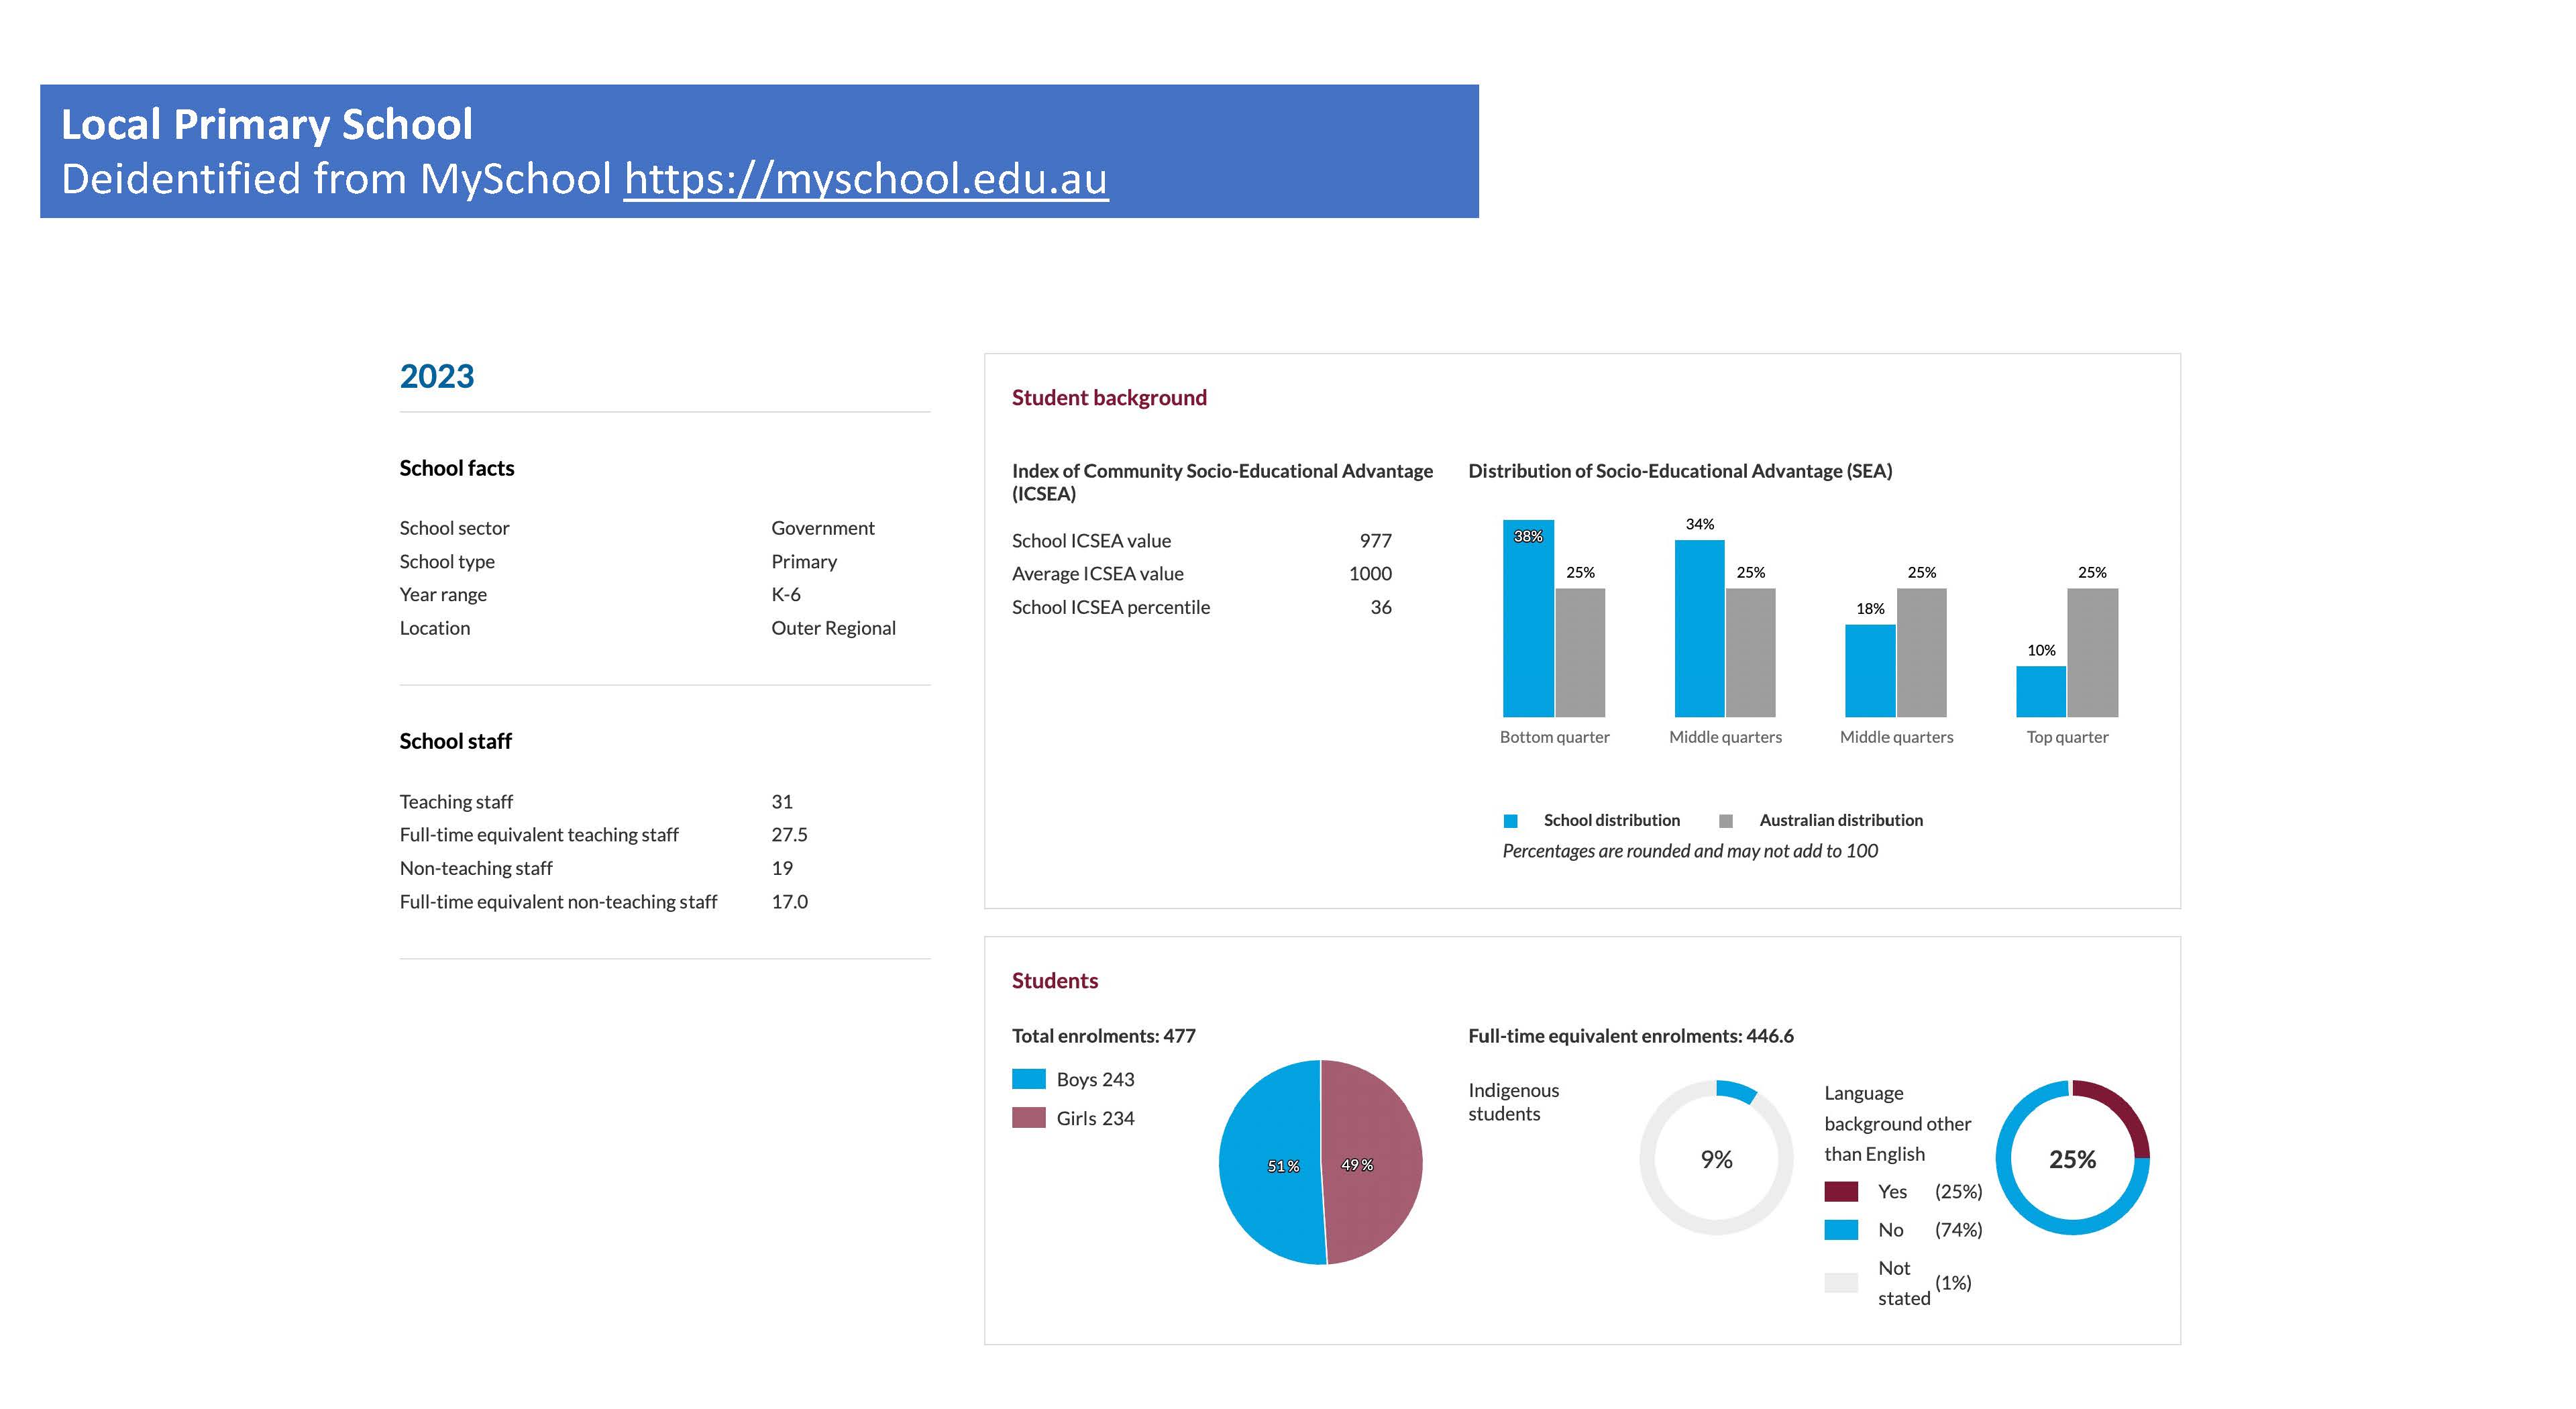
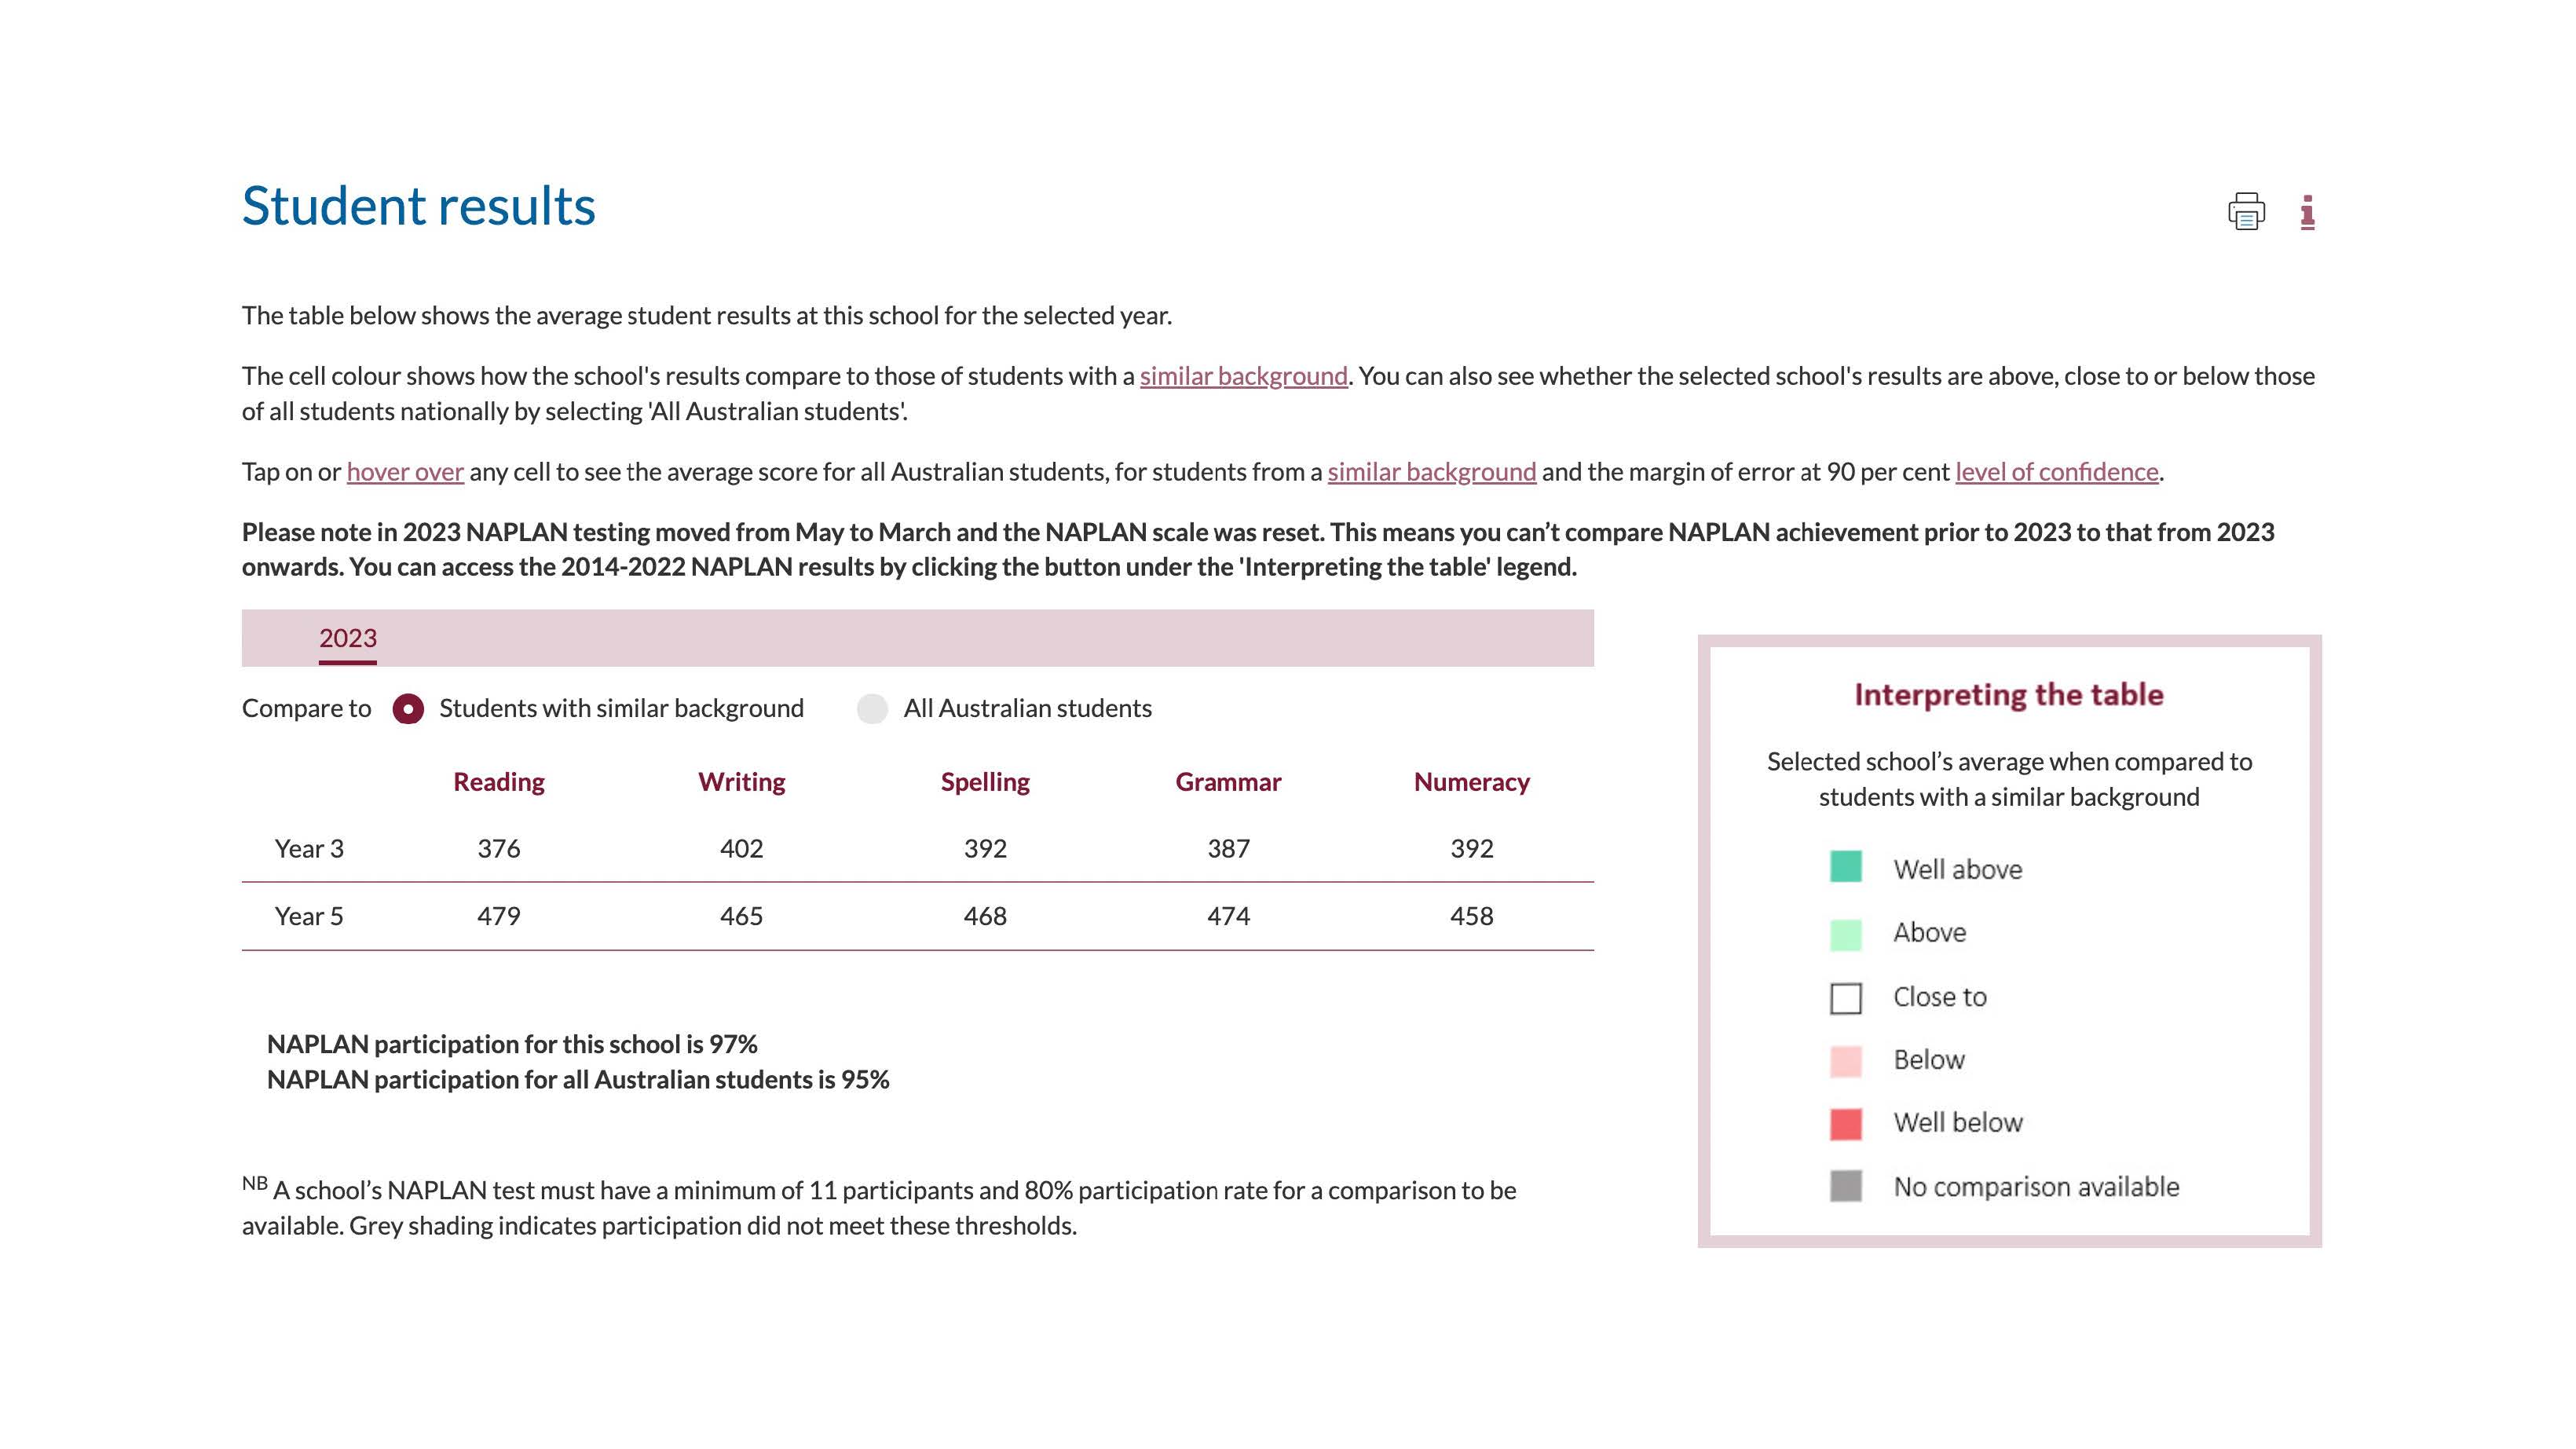
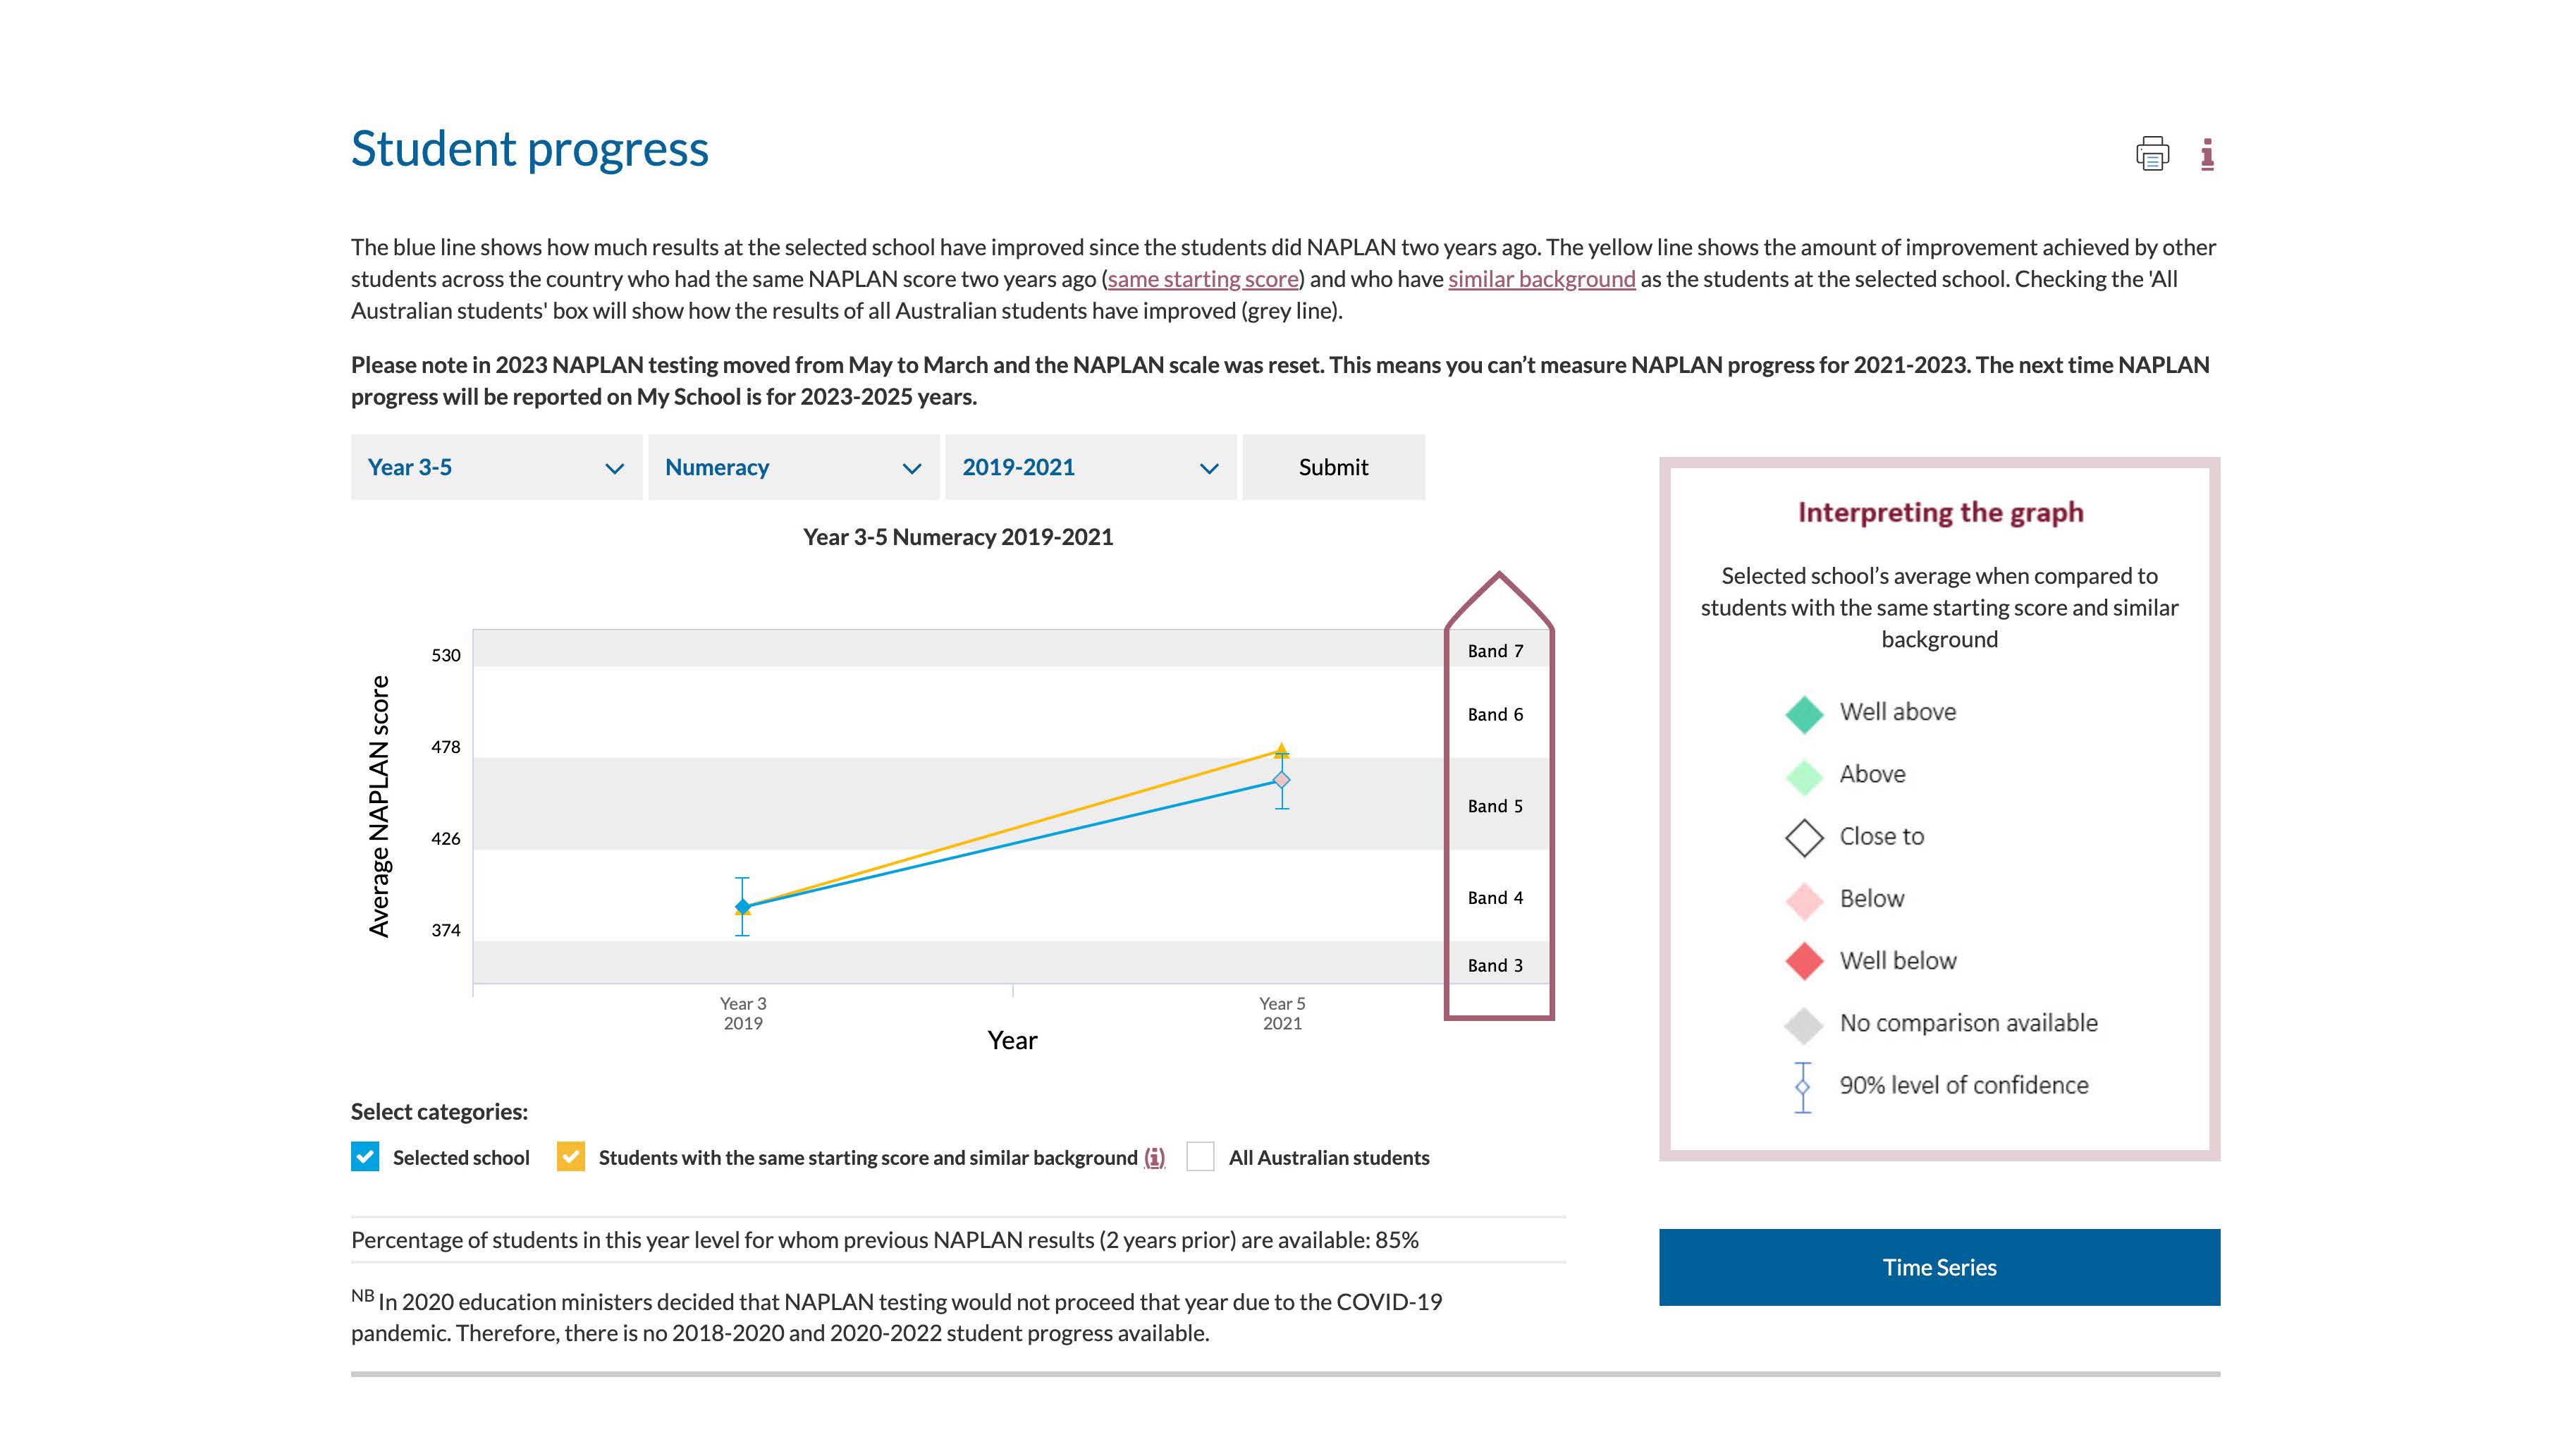
EEE755 Numeracy, social justice and new pedagogies Assessment Task 2 Community Case Study Australian Bureau of Statistics Local Government Area Data Source: https://dbr.abs.gov.au/ Occupation of employed persons - Persons aged 15 years and over - Census Description 201 2016 2021 Managers (%) 93 89 96 Professionals (%) 136 14.2 14.3 Technicians and trades workers (%) 222 214 226 Community and personal service workers (%) 84 96 97 Clerical and administrative workers (%) 126 109 12 Sales workers (%) 69 78 63 Machinery operators and drivers (%) 159 168 159 Labourers (%) 95 87 89 Occupation inadequately described or not stated (%) 15 16 14 Labour force status - Persons aged 15 years and over - Census Description 20m 2016 2021 Employed (no.) 7092 6913 7170 Unemployed (no.) 347 445 247 In the Labour force (no.) 7442 7356 7415 Unemployment rate (%) a7 6 33 Participation rate (%) 688 68 716 Not in the labour force (%) 192 214 188 Labour force status not stated (%) 12 106 96 Total persons aged 15 years and over (no.) 10 816 10817 10 353 Key statistics XY Estimated resident population (no.) Working age population (aged 15-64 years) (%) Estimated resident Aboriginal and Torres Strait Islander population (no.) Speakers of an Aboriginal or Torres Strait Islander language who identify as Aboriginal and/or Torres Strait Islander (%) Persons born overseas (no.) Children enrolled in a preschool or preschool program (no.) Age pension (no.) Median total income (excl. Government pensions and allowances) ($) Total number of businesses Number of jobs Median weekly household rental payment ($) Median monthly household mortgage payment ($) Land area (ha) Total protected land area (ha) Year 2022 2022 2021 2021 2021 2021 2023 2020 2022 2020 2021 2021 2021 2022 Region 13732 69.2 1394 8.4 3593 221 618 71240 1234 13 501 300 1700 23495 No data available Austi ia 26 005 540 64.6 983709 10 7029 262 339015 2598190 52338 2569 900 19 990 090 375 1863 768 809 493.8 169 668 198 Highest year of school completed - Persons aged 15 years and over who are no longer attending primary or secondary school - Census Description 2011 2016 2021 Completed year 12 or equivalent (%) 37.8 421 46.6 Completed year 11 or equivalent (%) 12.5 12.3 1.7 Completed year 10 or equivalent (%) 26.2 24.8 23.4 Completed year 9 or equivalent (%) 49 4.4 4 Completed year 8 or below (%) 36 32 25 Highest year of school completed not stated (%) 14.6 12.8 1.3 Did not go to school (%) 0.4 0.3 0.5 Youth engagement in work/study - Persons aged 15-19 years - Census Description 2011 2016 2021 Working full-time and studying part-time (%) 51 2.9 6.9 Working part time and studying part-time (%) 17 2 0.8 Working part-time and studying full-time (%) 13.5 19.9 237 Working full-time (not studying) (%) 21.2 12.8 17.4 Studying full-time (not working) (%) 255 332 26.3 Working full-time and studying full-time (%) 0.5 0.5 0.7 Working (away from work) and studying full-time (%) 0.8 - 12 Other fully engaged (%) 23 0.9 0.7 Total fully engaged (%) 69.4 72 775 Total persons aged 15-19 years (no.) 962 864 765 Local Primary School Deidentified from MySchool https://myschool.edu.au 2023 Student background School facts Index of Community Socio-Educational Advantage Distribution of Socio-Educational Advantage (SEA) ICSEA) School sector Government 34% School ICSEA value 977 38% School type Primary Average ICSEA value 1000 25% 25% 25% 25% Year range K-6 School ICSEA percentile 36 18% Location Outer Regional 10% School staff Bottom quarter Middle quarters Middle quarters Top quarter Teaching staff 31 School distribution Australian distribution Full-time equivalent teaching staff 27.5 Percentages are rounded and may not add to 100 Non-teaching staff 19 Full-time equivalent non-teaching staff 17.0 Students Total enrolments: 477 Full-time equivalent enrolments: 446.6 Boys 243 Indigenous Language Girls 234 students background other 51% 49% 9% than English 25% Yes (25%) No (74%) Not (1%) statedStudent results The table below shows the average student results at this school for the selected year. The cell colour shows how the school's results compare to those of students with a similar background. You can also see whether the selected school's results are above, close to or below those of all students nationally by selecting 'All Australian students" Tap on or hover over any cell to see the average score for all Australian students, for students from a similar background and the margin of error at 90 per cent level of confidence. Please note in 2023 NAPLAN testing moved from May to March and the NAPLAN scale was reset. This means you can't compare NAPLAN achievement prior to 2023 to that from 2023 onwards. You can access the 2014-2022 NAPLAN results by clicking the button under the 'Interpreting the table' legend. 2023 Compareto @) Students with similar background All Australian students Interpreting the table s s 5 Selected school's average when compared to Reading Writing Spelling Grammar Numeracy students with a similar background Year 3 376 402 392 387 392 Well above Year 5 479 465 468 474 458 Reove [ Closeto NAPLAN participation for this school is 97% Baiowi NAPLAN participation for all Australian students is 95% B Well below NB A school's NAPLAN test must have a minimum of 11 participants and 80% participation rate for a comparison to be B No comparison available available. Grey shading indicates participation did not meet these thresholds. Student progress S i The blue line shows how much results at the selected school have improved since the students did NAPLAN two years ago. The yellow line shows the amount of improvement achieved by other students across the country who had the same NAPLAN score two years ago (same starting score) and who have similar background as the students at the selected school. Checking the 'All Australian students' box will show how the results of all Australian students have improved (grey line). Please note in 2023 NAPLAN testing moved from May to March and the NAPLAN scale was reset. This means you can't measure NAPLAN progress for 2021-2023. The next time NAPLAN progress will be reported on My School is for 2023-2025 years. Year 3-5 v Numeracy v 2019-2021 v Submit Interpreting the graph Year 3-5 Numeracy 2019-2021 Selected school's average when compared to students with the same starting score and similar background 530 o &= s Well above @ Zz a7 S Above o Close to @ oD g Below
Step by Step Solution
There are 3 Steps involved in it

Get step-by-step solutions from verified subject matter experts