Question: CASE STUDY: Retail Facility Layout Design A department store has shown a recent decline in sales. The store manager has noticed a decrease in the
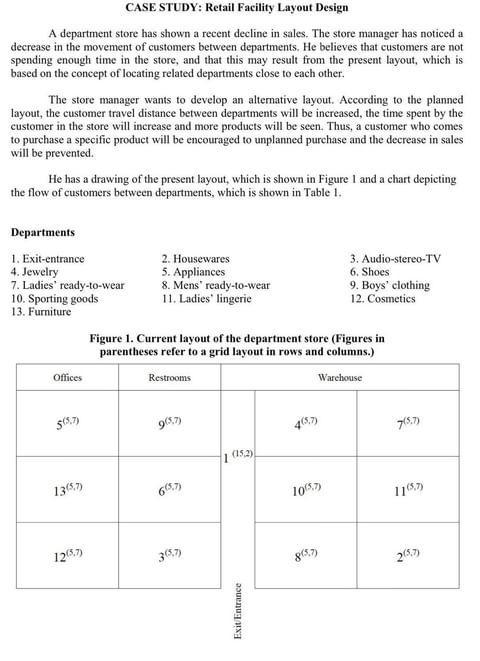
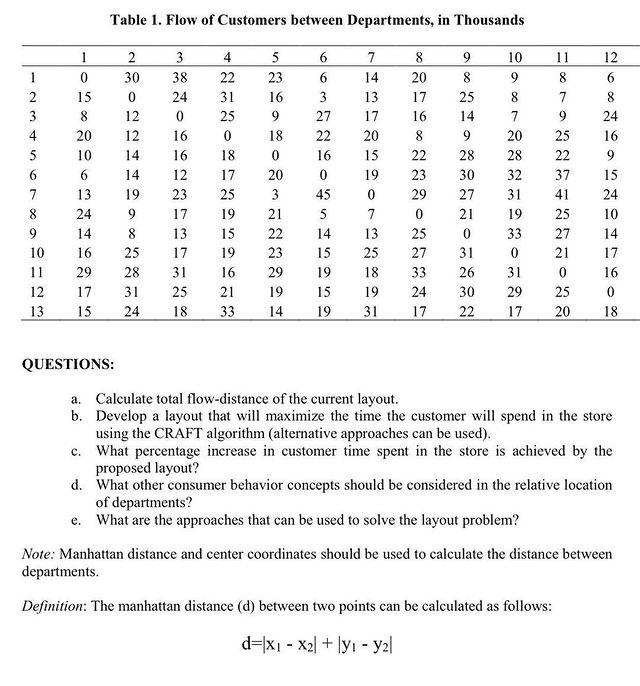
CASE STUDY: Retail Facility Layout Design A department store has shown a recent decline in sales. The store manager has noticed a decrease in the movement of customers between departments. He believes that customers are not spending enough time in the store, and that this may result from the present layout, which is based on the concept of locating related departments close to each other. The store manager wants to develop an alternative layout. According to the planned layout, the customer travel distance between departments will be increased, the time spent by the customer in the store will increase and more products will be seen. Thus, a customer who comes to purchase a specific product will be encouraged to unplanned purchase and the decrease in sales will be prevented. He has a drawing of the present layout, which is shown in Figure I and a chart depicting the flow of customers between departments, which is shown in Table 1. Departments 1. Exit-entrance 2. Housewares 3. Audio-stereo-TV 4. Jewelry 5. Appliances 6. Shoes 7. Ladies' ready-to-wear 8. Mens' ready-to-wear 9. Boys' clothing 10. Sporting goods 11. Ladies" lingerie 12. Cosmetics 13. Furniture Figure 1. Current layout of the department store (Figures in parentheses refer to a grid layout in rows and columns.) Offices Restrooms Warehouse 5(5.7) 905.7) 4057 7(5.7) 1 (15.2) 13(57) 10057 1105 1205,7) 8(57) 20,7) Exit Entrance Table 1. Flow of Customers between Departments, in Thousands 3 38 24 1 2 3 4 5 6 7 8 9 10 11 12 13 1 0 15 8 20 10 6 13 24 14 16 29 17 15 2 30 0 12 12 14 14 19 9 8 25 28 31 24 16 16 12 23 17 13 17 31 25 18 4 22 31 25 0 18 17 25 19 15 19 16 21 33 5 23 16 9 18 0 20 3 21 22 23 29 19 14 6 6 3 27 22 16 0 45 5 14 15 19 15 19 7 14 13 17 20 15 19 0 7 13 25 18 19 31 8 20 17 16 8 22 23 29 0 25 27 33 24 17 9 8 25 14 9 28 30 27 21 0 31 26 30 22 10 9 8 7 20 28 32 31 19 33 0 31 29 17 11 8 7 9 25 22 37 41 25 27 21 0 25 20 12 6 8 24 16 9 15 24 10 14 17 16 0 18 QUESTIONS: a. Calculate total flow-distance of the current layout. b. Develop a layout that will maximize the time the customer will spend in the store using the CRAFT algorithm (alternative approaches can be used). c. What percentage increase in customer time spent in the store is achieved by the proposed layout? d. What other consumer behavior concepts should be considered in the relative location of departments? e. What are the approaches that can be used to solve the layout problem? Note: Manhattan distance and center coordinates should be used to calculate the distance between departments. Definition: The manhattan distance (d) between two points can be calculated as follows: d=x1 - x2] + ly - yal CASE STUDY: Retail Facility Layout Design A department store has shown a recent decline in sales. The store manager has noticed a decrease in the movement of customers between departments. He believes that customers are not spending enough time in the store, and that this may result from the present layout, which is based on the concept of locating related departments close to each other. The store manager wants to develop an alternative layout. According to the planned layout, the customer travel distance between departments will be increased, the time spent by the customer in the store will increase and more products will be seen. Thus, a customer who comes to purchase a specific product will be encouraged to unplanned purchase and the decrease in sales will be prevented. He has a drawing of the present layout, which is shown in Figure I and a chart depicting the flow of customers between departments, which is shown in Table 1. Departments 1. Exit-entrance 2. Housewares 3. Audio-stereo-TV 4. Jewelry 5. Appliances 6. Shoes 7. Ladies' ready-to-wear 8. Mens' ready-to-wear 9. Boys' clothing 10. Sporting goods 11. Ladies" lingerie 12. Cosmetics 13. Furniture Figure 1. Current layout of the department store (Figures in parentheses refer to a grid layout in rows and columns.) Offices Restrooms Warehouse 5(5.7) 905.7) 4057 7(5.7) 1 (15.2) 13(57) 10057 1105 1205,7) 8(57) 20,7) Exit Entrance Table 1. Flow of Customers between Departments, in Thousands 3 38 24 1 2 3 4 5 6 7 8 9 10 11 12 13 1 0 15 8 20 10 6 13 24 14 16 29 17 15 2 30 0 12 12 14 14 19 9 8 25 28 31 24 16 16 12 23 17 13 17 31 25 18 4 22 31 25 0 18 17 25 19 15 19 16 21 33 5 23 16 9 18 0 20 3 21 22 23 29 19 14 6 6 3 27 22 16 0 45 5 14 15 19 15 19 7 14 13 17 20 15 19 0 7 13 25 18 19 31 8 20 17 16 8 22 23 29 0 25 27 33 24 17 9 8 25 14 9 28 30 27 21 0 31 26 30 22 10 9 8 7 20 28 32 31 19 33 0 31 29 17 11 8 7 9 25 22 37 41 25 27 21 0 25 20 12 6 8 24 16 9 15 24 10 14 17 16 0 18 QUESTIONS: a. Calculate total flow-distance of the current layout. b. Develop a layout that will maximize the time the customer will spend in the store using the CRAFT algorithm (alternative approaches can be used). c. What percentage increase in customer time spent in the store is achieved by the proposed layout? d. What other consumer behavior concepts should be considered in the relative location of departments? e. What are the approaches that can be used to solve the layout problem? Note: Manhattan distance and center coordinates should be used to calculate the distance between departments. Definition: The manhattan distance (d) between two points can be calculated as follows: d=x1 - x2] + ly - yal


