Question: CASE STUDY: River Pines School Tom Sanders is the headmaster of River Pines School. River Pines is a private, not-for-profit college preparatory school locatedin the
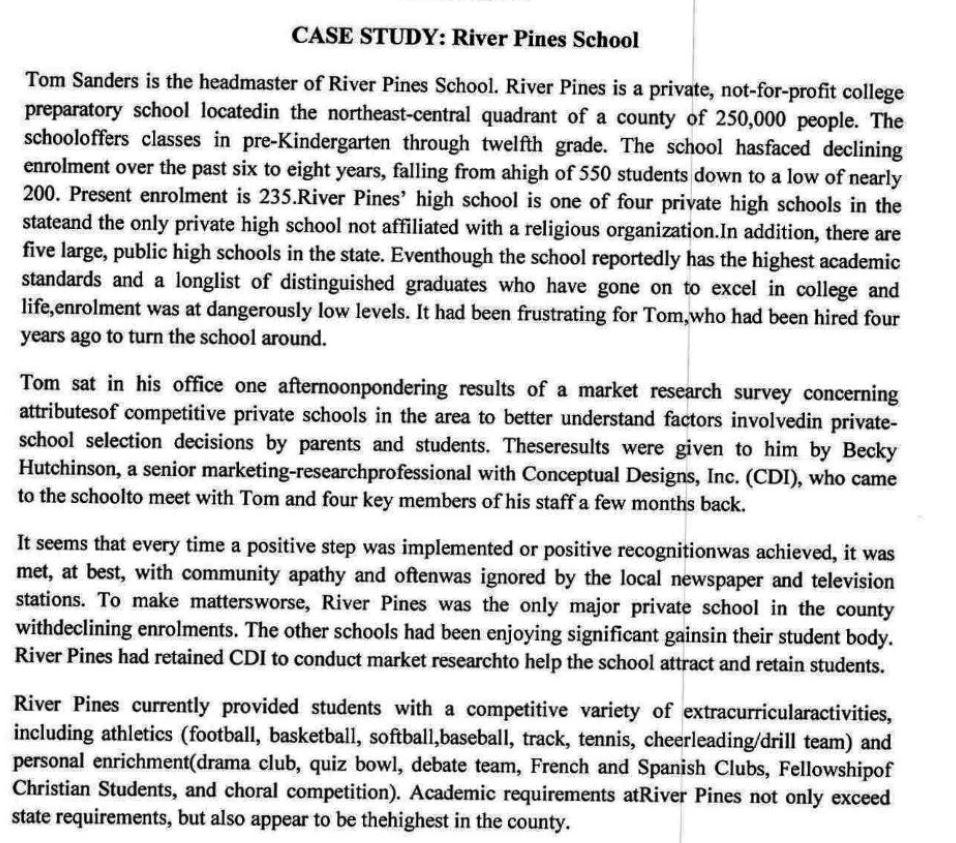
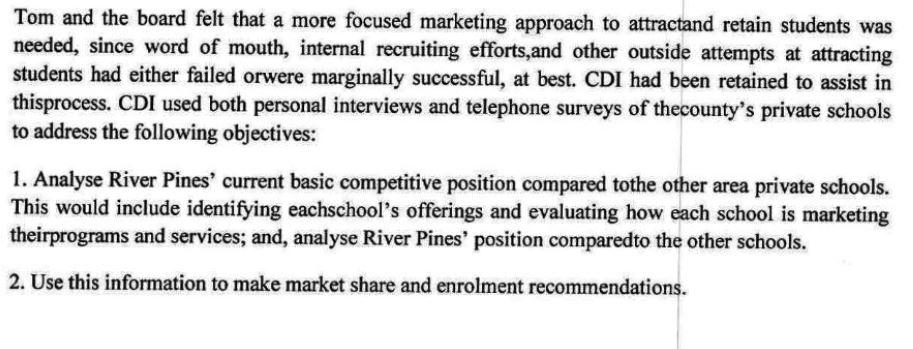
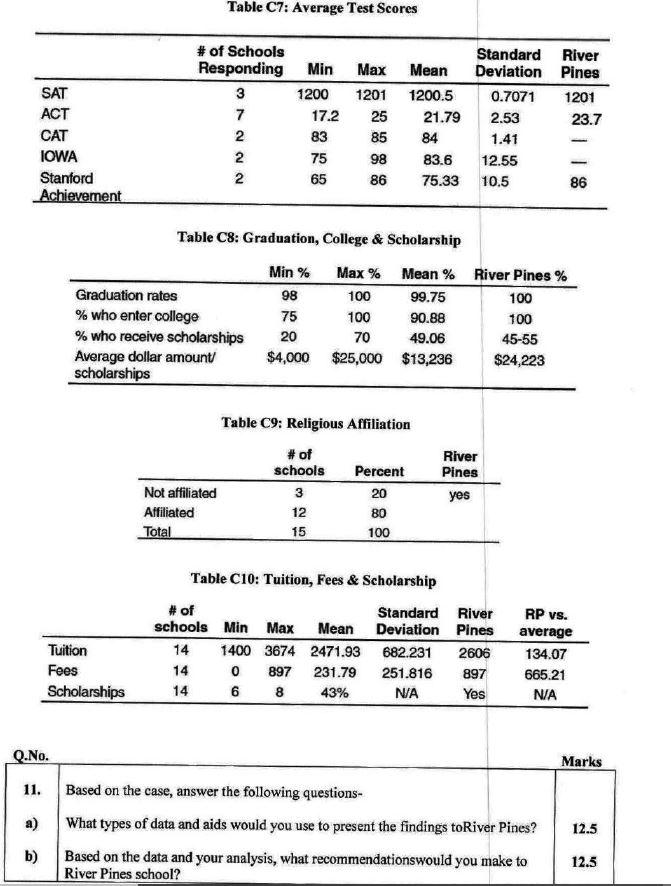
CASE STUDY: River Pines School Tom Sanders is the headmaster of River Pines School. River Pines is a private, not-for-profit college preparatory school locatedin the northeast-central quadrant of a county of 250,000 people. The schooloffers classes in pre-Kindergarten through twelfth grade. The school hasfaced declining enrolment over the past six to eight years, falling from ahigh of 550 students down to a low of nearly 200. Present enrolment is 235.River Pines' high school is one of four private high schools in the stateand the only private high school not affiliated with a religious organization. In addition, there are five large, public high schools in the state. Eventhough the school reportedly has the highest academic standards and a longlist of distinguished graduates who have gone on to excel in college and life,enrolment was at dangerously low levels. It had been frustrating for Tom,who had been hired four years ago to turn the school around. Tom sat in his office one afternoonpondering results of a market research survey concerning attributesof competitive private schools in the area to better understand factors involvedin private- school selection decisions by parents and students. Theseresults were given to him by Becky Hutchinson, a senior marketing-researchprofessional with Conceptual Designs, Inc. (CDI), who came to the schoolto meet with Tom and four key members of his staff a few months back. It seems that every time a positive step was implemented or positive recognitionwas achieved, it was met, at best, with community apathy and oftenwas ignored by the local newspaper and television stations. To make mattersworse, River Pines was the only major private school in the county withdeclining enrolments. The other schools had been enjoying significant gainsin their student body. River Pines had retained CDI to conduct market researchto help the school attract and retain students. River Pines currently provided students with a competitive variety of extracurricularactivities, including athletics (football, basketball, softball,baseball, track, tennis, cheerleading/drill team) and personal enrichment(drama club, quiz bowl, debate team, French and Spanish Clubs, Fellowshipof Christian Students, and choral competition). Academic requirements atRiver Pines not only exceed state requirements, but also appear to be thehighest in the county. Tom and the board felt that a more focused marketing approach to attractand retain students was needed, since word of mouth, internal recruiting efforts and other outside attempts at attracting students had either failed orwere marginally successful, at best. CDI had been retained to assist in thisprocess. CDI used both personal interviews and telephone surveys of thecounty's private schools to address the following objectives: 1. Analyse River Pines' current basic competitive position compared tothe other area private schools. This would include identifying eachschool's offerings and evaluating how each school is marketing theirprograms and services; and, analyse River Pines' position comparedto the other schools. 2. Use this information to make market share and enrolment recommendations. Competitive information collected included levels of offered grades, primarygeographic area of students, numbers of students and faculty members, fees and fee structures, extracurricular activities, educational achievements(ACT, SAT scores), scholarship offers, and whether or not theschools were religious- or secular-based. From this information, CDI wasable to develop a list of characteristics, including five-year enrolmenttrends, average student-teacher ratios, standardized test scores, performance-based or needs-based scholarship opportunities for existing and prospectivestudents, to mention only a few. Results of the findings are includedas tables C1 through CIO. Table C1: Grades Offered and Enrollment for 2017 RP VS. River Pines 9 11 14 12 32 18 21 Grade Pre-K Kindergarten First Second Third Fourth Fifth Sixth Seventh Eighth Ninth Tenth Eleventh Twelfth # of Standard schools Min Max Mean Deviation 1 150 38.91 45.67 2 52 26.00 17.08 13 61 28.54 17.21 13 60 23.62 16.23 12 2 60 27.17 17.11 12 2 60 28.75 19.80 13 1 60 23.92 18.14 12 3 60 25.00 17.77 2 71 28.54 23.10 11 7 60 33.55 15.76 9 3 89 41.22 28.24 9 2 96 39.56 29.00 9 6 97 40.11 28.73 9 2 85 37.11 26.55 15 11 17 average -29.91 -14.00 3.46 -5.62 6.17 -13.75 -12.92 8.00 -14.54 -6.55 24.22 -24.56 -24.11 -14.11 13 14 27 17 15 16 23 Table C2: Enrolment for the Past Five Years Year # of schools Min RP vs. Max Mean River Pines 14 30 14 2012 2013 2014 2015 2016 589 627 627 30 30 37 10 Standard Deviation 172.76 185.19 197.67 206.16 226.34 269.71 286.14 281.40 306.13 313.60 15 15 15 average 94.29 60.86 41.60 3.13 -71.60 364 347 323 303 242 671 700 98 Area 1 Area 2 Area 3 Area 4 Area 5 Area 6 Other Table C3: Geographical Areas of Students Standard River # of schools Min % Max % Mean % Deviation % Pines % 11 20 62.00 27.37 96 12 1 100 33.67 30.83 1 2 5 5 5.00 0.00 3 2 80 29.00 44.19 1 50 50 50.00 0.00 2 1 54 27.50 37.48 1 11 1 19.73 16.39 ONO 50 0 Table C4: Faculty size & Student Teacher Ratio # of Standard schools Min Max Mean Deviation 15 3 26.13 16.30 14 6 20 12.50 4.03 59 Faculty Size Student Teacher Ratio River Pines 29 9 RP vs. Avg. 2.87 -3.50 Table C5: Sports Programs Softball Baseball Football Basketball Soccer Track Tennis Cross-country Golf Other Is Not Offered Offered 6 8 6 8 10 4 2 5 9 7 7 4 10 3 11 7 7 6 9 % Offering 42.86 42.86 71.43 85.71 35.71 50.00 28.57 21.43 50.00 42.86 Standard Deviation River Pines 0.4972 Offered 0.5136 Offered 0.4688 Offered 0.3631 Offered 0.1972 Not Offered 0.5189 Offered 0.1688 Offered 0.4258 Offered 0.5189 Offered 0.5071 Offered Table C6: Extracurricular Activities Available River Pines Few Some Many Total # of schools 6 4 4 14 Percent 42.9 28.6 28.6 100.0 yes Table C7: Average Test Scores # of Schools Responding Min 3 1200 7 17.2 Max Mean 1201 1200.5 25 21.79 85 84 98 83.6 86 75.33 SAT ACT CAT IOWA Stanford Achievement Standard River Deviation Pines 0.7071 1201 2.53 23.7 1.41 12.55 10.5 86 83 NNN 75 65 Table C8: Graduation, College & Scholarship Min % Max % Mean % River Pines% Graduation rates 98 100 99.75 100 % who enter college 75 100 90.88 100 % who receive scholarships 20 70 49.06 45-55 Average dollar amount $4,000 $25,000 $13,236 $24,223 scholarships Table C9: Religious Affiliation # of schools 3 12 15 Not affiliated Affiliated Total River Pines yes Percent 20 BO 100 Table C10: Tuition, Fees & Scholarship # of Standard River schools Min Max Mean Deviation Pines 14 1400 3674 2471.93 682.231 2606 14 0 897 231.79 251.816 897 14 6 8 43% NA Yes Tuition Fees Scholarships RP vs. average 134.07 665.21 NA Q.No. Marks 11. a) Based on the case, answer the following questions- What types of data and aids would you use to present the findings toRiver Pines? Based on the data and your analysis, what recommendationswould you make to River Pines school? 12.5 b) 12.5


