

Question: Case Study: Zero-Based Budgeting In 2016, Food Dive reported that packaged food manufacturers were seeing sales decline as consumers turned away from foods like mass-produced
Case Study: Zero-Based Budgeting
In 2016, Food Dive reported that packaged food manufacturers were seeing sales decline as consumers turned away from foods like mass-produced soda and cereal.[1]
Responding to declining sales and rising costs, manufacturers implemented aggressive cost-cutting initiatives that led to massive layoffs and factory shutdowns. Some companies, like PepsiCo, implemented new management strategies, such as zero-based budgeting (ZBB).[2]
Under zero-base budgeting, managers in a company start each year with zero budget levels and must justify every dollar that appears in the budget. Managers do not assume any costs incurred in previous years should be incurred this year. Each manager prepares decision packages that describe the nature and cost of tasks that can be performed by that unit and the consequences of not performing each task. Top organization officials rank the decision packages and approve those that they believe are most worthy. A major drawback to the use of this concept is the massive amounts of paperwork and time needed to prepare and rank decision packages, especially in large organizations.
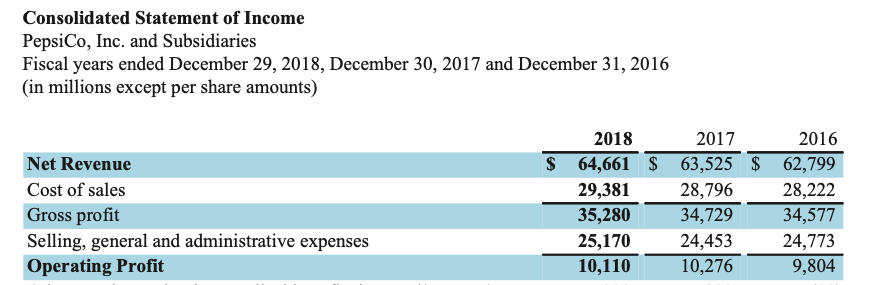
PepsiCo expected to save $1 billion per year in 2016 and beyond due to zero-based budgeting and several other related efforts to streamline the organization and optimize manufacturing. But in reality, the effects of ZBB are harder to quantify. Sales increased from 63 billion in 2016 to 64.7 billion in 2018, an increase of 1.7 billion. Cost of goods sold increased as well, and so did SG&A. Examine the results of operations presented here and see if you can determine the relationships between the numbers. Notice that these are stated in millions, so $64,661 is actually $64.661 billion.
Step by Step Solution
There are 3 Steps involved in it

Get step-by-step solutions from verified subject matter experts