

Question: Casey wants a pie chart representing how each membership package contributed to the Inception Workspace's total annual income in 2019. Select the range A5: B9,
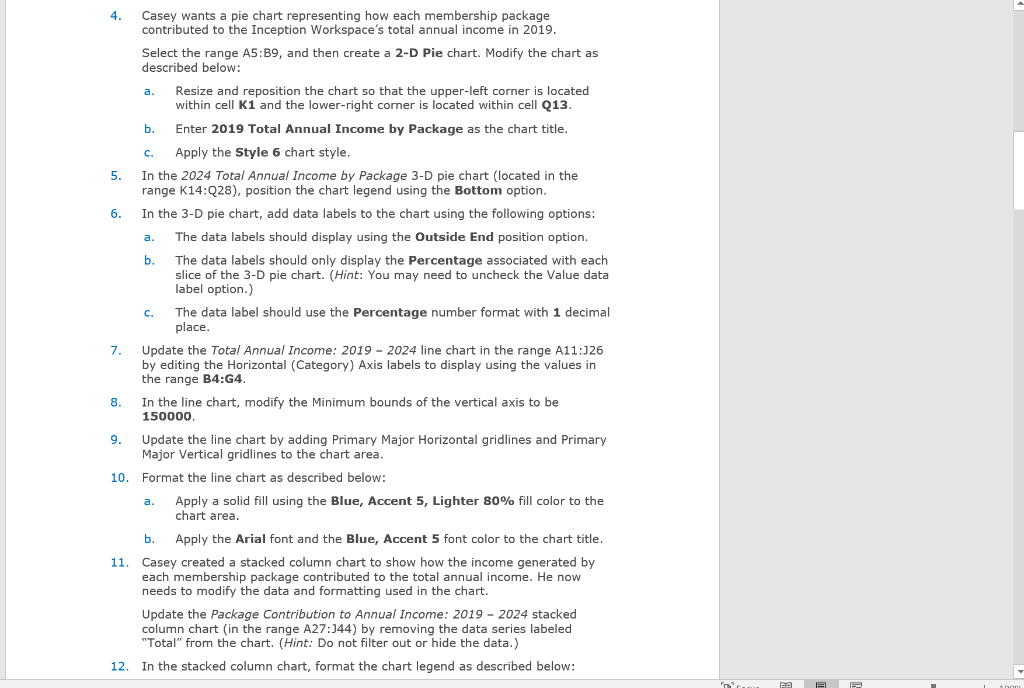
Casey wants a pie chart representing how each membership package contributed to the Inception Workspace's total annual income in 2019. Select the range A5: B9, and then create a 2-D Pie chart. Modify the chart as described below: a. Resize and reposition the chart so that the upper-left corner is located within cell K1 and the lower-right corner is located within cell Q13. b. Enter 2019 Total Annual Income by Package as the chart title. c. Apply the Style 6 chart style. In the 2024 Total Annual Income by Package 3-D pie chart (located in the range K14:Q28), position the chart legend using the Bottom option. In the 3-D pie chart, add data labels to the chart using the following options: a. The data labels should display using the Outside End position option. b. The data labels should only display the Percentage associated with each slice of the 3-D pie chart. (Hint: You may need to uncheck the Value data label option.) C. The data label should use the Percentage number format with 1 decimal place Update the Total Annual Income: 2019-2024 line chart in the range A11:326 by editing the Horizontal (Category) Axis labels to display using the values in the range B4:G4. In the line chart, modify the Minimum bounds of the vertical axis to be 150000 7. 8. Update the line chart by adding Primary Major Horizontal gridlines and Primary Major Vertical gridlines to the chart area. 10. Format the line chart as described below: a. Apply a solid fill using the Blue, Accent 5, Lighter 80% fill color to the chart area. b. Apply the Arial font and the Blue, Accent 5 font color to the chart title. Casey created a stacked column chart to show how the income generated by each membership package contributed to the total annual income. He now needs to modify the data and formatting used in the chart. 11. Update the Package Contribution to Annual Income: 2019-2024 stacked column chart in the range A27:144) by removing the data series labeled "Total" from the chart. (Hint: Do not filter out or hide the data 12. In the stacked column chart, format the chart legend as described below: Casey wants a pie chart representing how each membership package contributed to the Inception Workspace's total annual income in 2019. Select the range A5: B9, and then create a 2-D Pie chart. Modify the chart as described below: a. Resize and reposition the chart so that the upper-left corner is located within cell K1 and the lower-right corner is located within cell Q13. b. Enter 2019 Total Annual Income by Package as the chart title. c. Apply the Style 6 chart style. In the 2024 Total Annual Income by Package 3-D pie chart (located in the range K14:Q28), position the chart legend using the Bottom option. In the 3-D pie chart, add data labels to the chart using the following options: a. The data labels should display using the Outside End position option. b. The data labels should only display the Percentage associated with each slice of the 3-D pie chart. (Hint: You may need to uncheck the Value data label option.) C. The data label should use the Percentage number format with 1 decimal place Update the Total Annual Income: 2019-2024 line chart in the range A11:326 by editing the Horizontal (Category) Axis labels to display using the values in the range B4:G4. In the line chart, modify the Minimum bounds of the vertical axis to be 150000 7. 8. Update the line chart by adding Primary Major Horizontal gridlines and Primary Major Vertical gridlines to the chart area. 10. Format the line chart as described below: a. Apply a solid fill using the Blue, Accent 5, Lighter 80% fill color to the chart area. b. Apply the Arial font and the Blue, Accent 5 font color to the chart title. Casey created a stacked column chart to show how the income generated by each membership package contributed to the total annual income. He now needs to modify the data and formatting used in the chart. 11. Update the Package Contribution to Annual Income: 2019-2024 stacked column chart in the range A27:144) by removing the data series labeled "Total" from the chart. (Hint: Do not filter out or hide the data 12. In the stacked column chart, format the chart legend as described below
Step by Step Solution
There are 3 Steps involved in it

Get step-by-step solutions from verified subject matter experts