

Question: cash flow from operating activities in 2017 operating profit margin (%) return on equity (%) net cash provided by operating activities Please help me solve
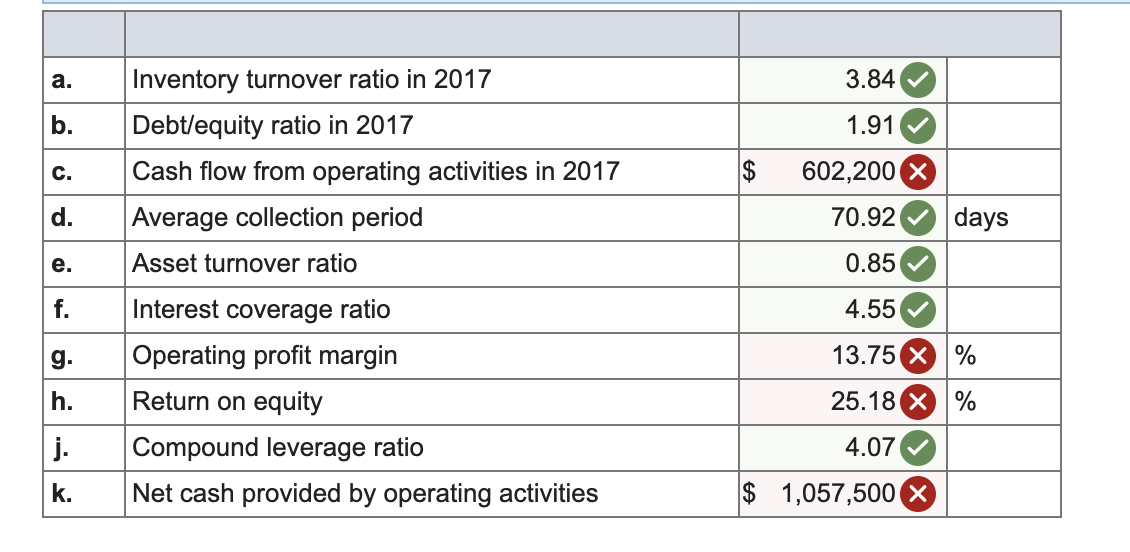
cash flow from operating activities in 2017
operating profit margin (%)
return on equity (%)
net cash provided by operating activities
Please help me solve these incorrect questions with explanations! Thank you!
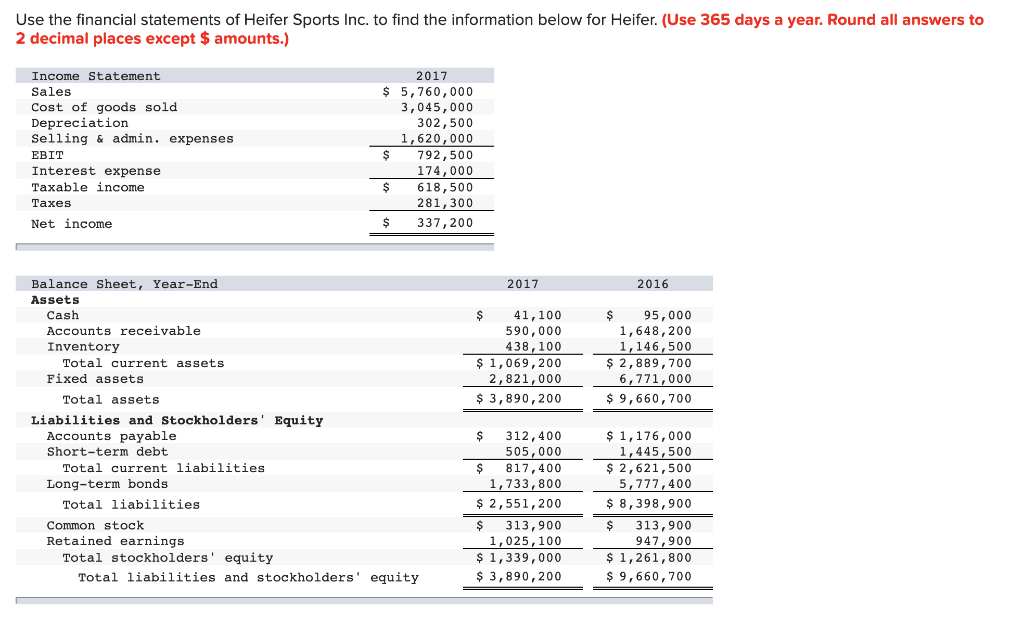
Use the financial statements of Heifer Sports Inc. to find the information below for Heifer. (Use 365 days a year. Round all answers to 2 decimal places except $ amounts.) Income Statement Sales Cost of goods sold Depreciation Selling & admin. expenses EBIT Tot Interest expense Taxable income Taxes Net income 2017 $ 5,760,000 3,045,000 302,500 1,620,000 $ 174,000 $ 618,500 281,300 $ 337,200 792,500 2017 2016 $ 41,100 590,000 438,100 $ 1,069, 200 2,821,000 $ 3,890,200 $ 95,000 1,648,200 1,146,500 $ 2,889,700 6,771,000 $ 9,660,700 Balance Sheet, Year-End Assets Cash Accounts receivable Inventory Total current assets Fixed assets Total assets Liabilities and Stockholders' Equity Accounts payable Short-term debt Total current liabilities Long-term bonds Total liabilities Common stock Retained earnings Total stockholders' equity Total liabilities and stockholders' equity $ 312,400 505,000 $ 817,400 1,733,800 $ 2,551,200 $ 313,900 1,025,100 $ 1,339,000 $ 3,890,200 $ 1,176,000 1,445,500 $ 2,621,500 5,777,400 $ 8, 398,900 $ 313,900 947,900 $1,261,800 $ 9,660, 700 a. 3.84 b. 1.91 Inventory turnover ratio in 2017 Debt/equity ratio in 2017 Cash flow from operating activities in 2017 Average collection period C. $ 602,200 X d. 70.92 days e. Asset turnover ratio 0.85 f. 4.55 g. Interest coverage ratio Operating profit margin Return on equity Compound leverage ratio Net cash provided by operating activities 13.75 X % 25.18 X % h. j. 4.07 k. $ 1,057,500 X
Step by Step Solution
There are 3 Steps involved in it

Get step-by-step solutions from verified subject matter experts