

Question: Cash FlowStatement Data begin{tabular}{|l|rr|} hline Net Income & $ & 6,304,000 hline Depreciation Expense & $ & 1,544,000 hline Change in accounts receivable
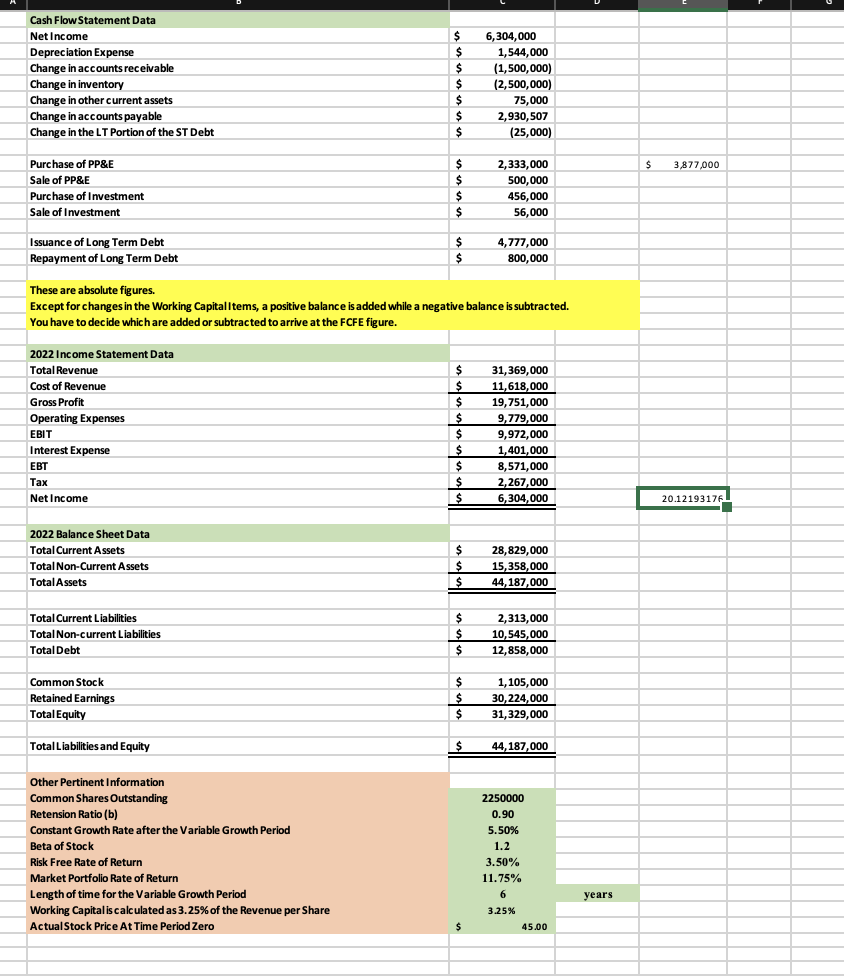
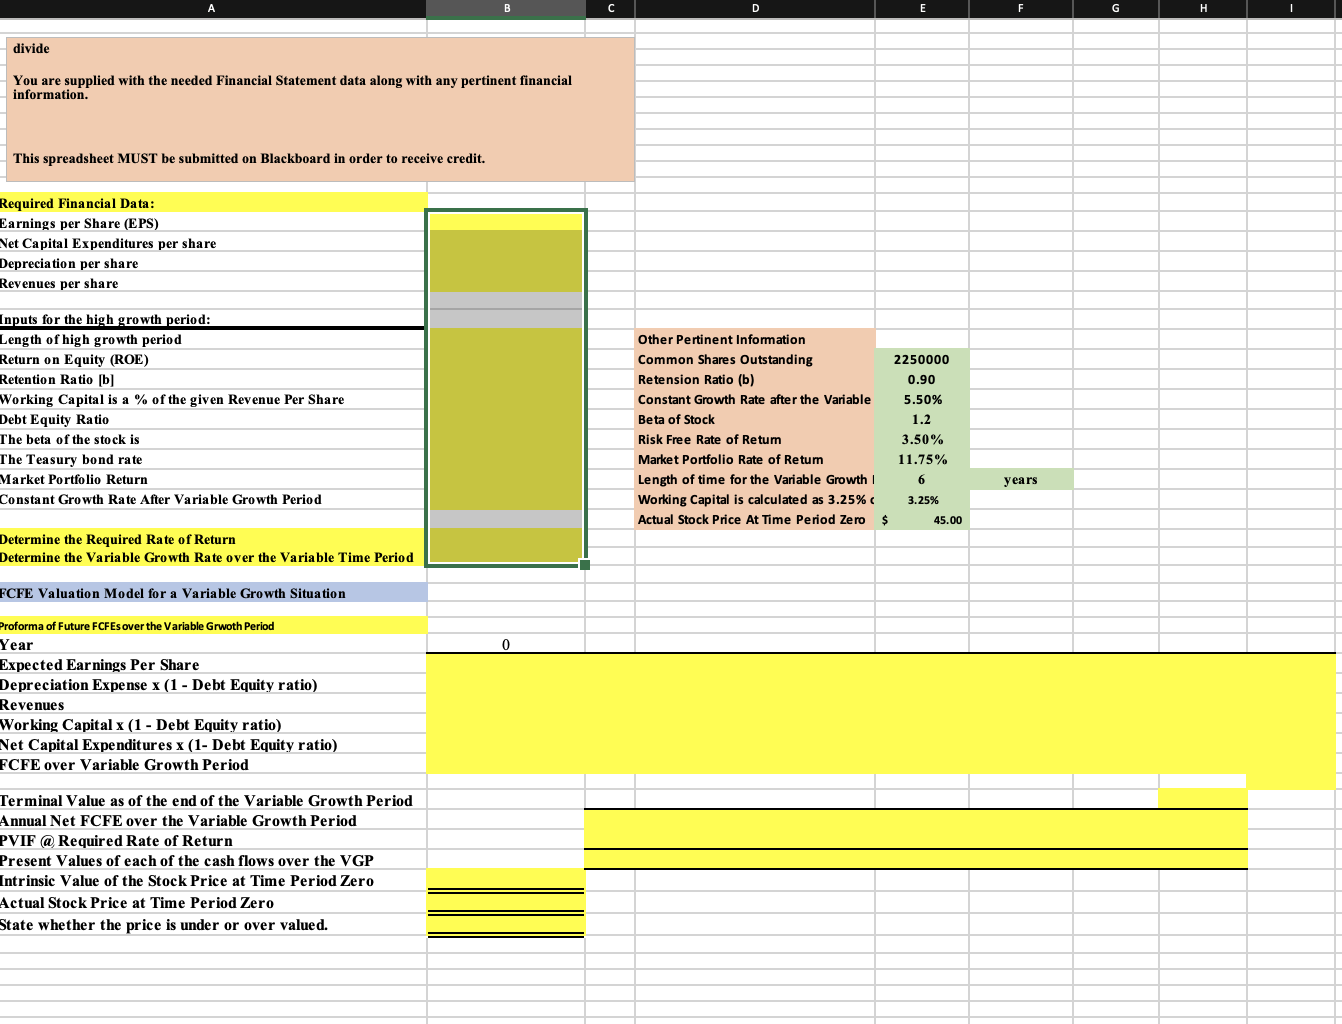
Cash FlowStatement Data \begin{tabular}{|l|rr|} \hline Net Income & $ & 6,304,000 \\ \hline Depreciation Expense & $ & 1,544,000 \\ \hline Change in accounts receivable & $ & (1,500,000) \\ \hline Change in inventory & $ & (2,500,000) \\ \hline Change in other current assets & $ & 75,000 \\ \hline Change in accounts payable & $ & 2,930,507 \\ \hline Change in the LT Portion of the ST Debt & $ & (25,000) \\ \hline \end{tabular} Purchase of PP\&E Sale of PP\&E Purchase of Investment Sale of Investment \begin{tabular}{|rr} $ & 2,333,000 \\ $ & 500,000 \\ \hline$ & 456,000 \\ \hline$ & 56,000 \\ \hline \end{tabular} Issuance of Long Term Debt Repayment of Long Term Debt These are absolute figures. Except for changes in the Working Capital Items, a positive balance is added while a negative balance is subtracted. You have to decide which are added or subtracted to arrive at the FCFE figure. 2022 Income Statement Data Total Revenue Cost of Revenue Gross Profit Operating Expenses EBIT Interest Expense EBT Tax Net Income \begin{tabular}{|rr} \hline$ & 31,369,000 \\ \hline$ & 11,618,000 \\ \hline$ & 19,751,000 \\ \hline$ & 9,779,000 \\ \hline$ & 9,972,000 \\ \hline$ & 1,401,000 \\ \hline$ & 8,571,000 \\ \hline$ & 2,267,000 \\ \hline$ & 6,304,000 \\ \hline \hline \end{tabular} 2022 Balance Sheet Data Total Current Assets Total Non-Current Assets TotalAssets \begin{tabular}{lr} \hline$ & 28,829,000 \\ $ & 15,358,000 \\ \hline$ & 44,187,000 \\ \hline \hline \end{tabular} Total Current Liabilities Total Non-current Liabilities TotalDebt \begin{tabular}{|rr|} \hline$ & 2,313,000 \\ \hline$ & 10,545,000 \\ \hline$ & 12,858,000 \\ \hline \end{tabular} Common Stock Retained Earnings Total Equity \begin{tabular}{|rr} \hline$ & 1,105,000 \\ \hline$ & 30,224,000 \\ \hline$ & 31,329,000 \\ \hline \end{tabular} Total Liabilities and Equity $44,187,000 Other Pertinent Information Common Shares Outstanding Retension Ratio (b) Constant Growth Rate after the Variable Growth Period Beta of Stock Risk Free Rate of Return Market Portfolio Rate of Return Length of time for the Variable Growth Period Working Capital is calculated as 3.25% of the Revenue per Share ActualStock Price At Time Period Zero divide You are supplied with the needed Financial Statement data along with any pertinent financial information. This spreadsheet MUST be submitted on Blackboard in order to receive credit. Required Financial Data: Earnings per Share (EPS) Net Capital Expenditures per share Depreciation per share Revenues per share Inputs for the high growth period: Length of high growth period Other Pertinent Information Return on Equity (ROE) Common Shares Outstanding Retention Ratio [b] Retension Ratio (b) Working Capital is a \% of the given Revenue Per Share Constant Growth Rate after the Variable 5.50% Debt Equity Ratio The beta of the stock is BetaofStockRiskFreeRateofRetum1.23.50% The Teasury bond rate RiskFreeRateofRetumMarketPortfolioRateofRetum3.50%11.75% Market Portfolio Return Length of time for the Variable Constant Growth Rate After Variable Growth Period Working Capital is calculated as 3.25\% c 3.25% Actual Stock Price At Time Period Zero $45.00 Determine the Required Rate of Return Determine the Variable Growth Rate over the Variable Time Period FCFE Valuation Model for a Variable Growth Situation Proforma of Future FCFEs over the Variable Grwoth Period Year Expected Earnings Per Share Depreciation Expense x (1 - Debt Equity ratio) Revenues Working Capital x (1 - Debt Equity ratio) Net Capital Expenditures x (1- Debt Equity ratio) FCFE over Variable Growth Period Terminal Value as of the end of the Variable Growth Period Annual Net FCFE over the Variable Growth Period PVIF (a) Required Rate of Return Present Values of each of the cash flows over the VGP Intrinsic Value of the Stock Price at Time Period Zero Actual Stock Price at Time Period Zero State whether the price is under or over valued. Cash FlowStatement Data \begin{tabular}{|l|rr|} \hline Net Income & $ & 6,304,000 \\ \hline Depreciation Expense & $ & 1,544,000 \\ \hline Change in accounts receivable & $ & (1,500,000) \\ \hline Change in inventory & $ & (2,500,000) \\ \hline Change in other current assets & $ & 75,000 \\ \hline Change in accounts payable & $ & 2,930,507 \\ \hline Change in the LT Portion of the ST Debt & $ & (25,000) \\ \hline \end{tabular} Purchase of PP\&E Sale of PP\&E Purchase of Investment Sale of Investment \begin{tabular}{|rr} $ & 2,333,000 \\ $ & 500,000 \\ \hline$ & 456,000 \\ \hline$ & 56,000 \\ \hline \end{tabular} Issuance of Long Term Debt Repayment of Long Term Debt These are absolute figures. Except for changes in the Working Capital Items, a positive balance is added while a negative balance is subtracted. You have to decide which are added or subtracted to arrive at the FCFE figure. 2022 Income Statement Data Total Revenue Cost of Revenue Gross Profit Operating Expenses EBIT Interest Expense EBT Tax Net Income \begin{tabular}{|rr} \hline$ & 31,369,000 \\ \hline$ & 11,618,000 \\ \hline$ & 19,751,000 \\ \hline$ & 9,779,000 \\ \hline$ & 9,972,000 \\ \hline$ & 1,401,000 \\ \hline$ & 8,571,000 \\ \hline$ & 2,267,000 \\ \hline$ & 6,304,000 \\ \hline \hline \end{tabular} 2022 Balance Sheet Data Total Current Assets Total Non-Current Assets TotalAssets \begin{tabular}{lr} \hline$ & 28,829,000 \\ $ & 15,358,000 \\ \hline$ & 44,187,000 \\ \hline \hline \end{tabular} Total Current Liabilities Total Non-current Liabilities TotalDebt \begin{tabular}{|rr|} \hline$ & 2,313,000 \\ \hline$ & 10,545,000 \\ \hline$ & 12,858,000 \\ \hline \end{tabular} Common Stock Retained Earnings Total Equity \begin{tabular}{|rr} \hline$ & 1,105,000 \\ \hline$ & 30,224,000 \\ \hline$ & 31,329,000 \\ \hline \end{tabular} Total Liabilities and Equity $44,187,000 Other Pertinent Information Common Shares Outstanding Retension Ratio (b) Constant Growth Rate after the Variable Growth Period Beta of Stock Risk Free Rate of Return Market Portfolio Rate of Return Length of time for the Variable Growth Period Working Capital is calculated as 3.25% of the Revenue per Share ActualStock Price At Time Period Zero divide You are supplied with the needed Financial Statement data along with any pertinent financial information. This spreadsheet MUST be submitted on Blackboard in order to receive credit. Required Financial Data: Earnings per Share (EPS) Net Capital Expenditures per share Depreciation per share Revenues per share Inputs for the high growth period: Length of high growth period Other Pertinent Information Return on Equity (ROE) Common Shares Outstanding Retention Ratio [b] Retension Ratio (b) Working Capital is a \% of the given Revenue Per Share Constant Growth Rate after the Variable 5.50% Debt Equity Ratio The beta of the stock is BetaofStockRiskFreeRateofRetum1.23.50% The Teasury bond rate RiskFreeRateofRetumMarketPortfolioRateofRetum3.50%11.75% Market Portfolio Return Length of time for the Variable Constant Growth Rate After Variable Growth Period Working Capital is calculated as 3.25\% c 3.25% Actual Stock Price At Time Period Zero $45.00 Determine the Required Rate of Return Determine the Variable Growth Rate over the Variable Time Period FCFE Valuation Model for a Variable Growth Situation Proforma of Future FCFEs over the Variable Grwoth Period Year Expected Earnings Per Share Depreciation Expense x (1 - Debt Equity ratio) Revenues Working Capital x (1 - Debt Equity ratio) Net Capital Expenditures x (1- Debt Equity ratio) FCFE over Variable Growth Period Terminal Value as of the end of the Variable Growth Period Annual Net FCFE over the Variable Growth Period PVIF (a) Required Rate of Return Present Values of each of the cash flows over the VGP Intrinsic Value of the Stock Price at Time Period Zero Actual Stock Price at Time Period Zero State whether the price is under or over valued
Step by Step Solution
There are 3 Steps involved in it

Get step-by-step solutions from verified subject matter experts