

Question: Cash Payback Period, Net Present Value Method, and Analysis Elite Apparel Inc. is considering two investment projects. The estimated net cash flows from each project
Cash Payback Period, Net Present Value Method, and Analysis Elite Apparel Inc. is considering two investment projects. The estimated net cash flows from each project are as follows:?
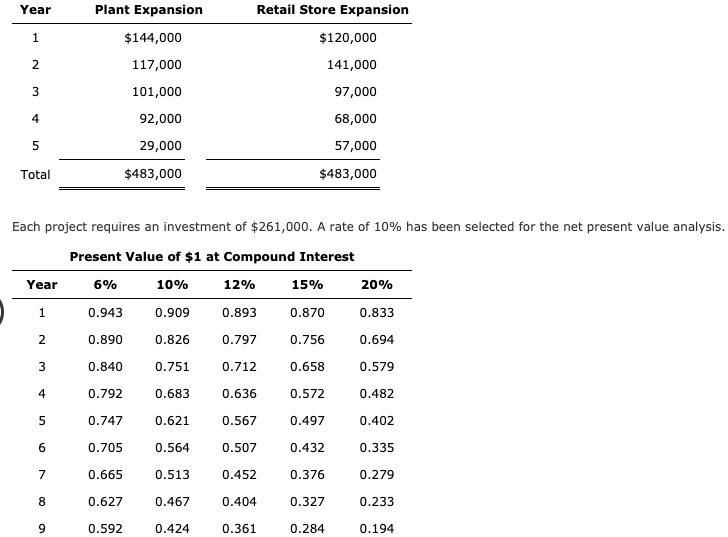
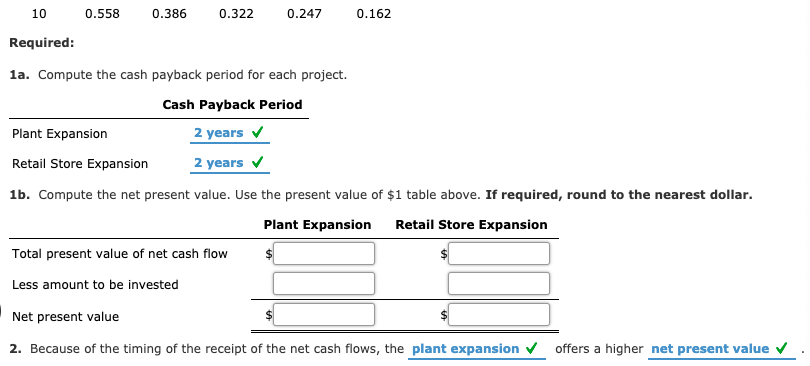
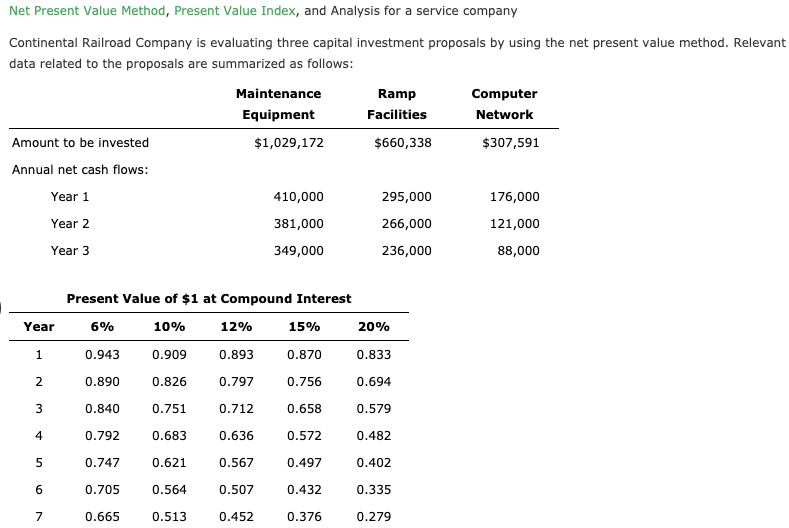
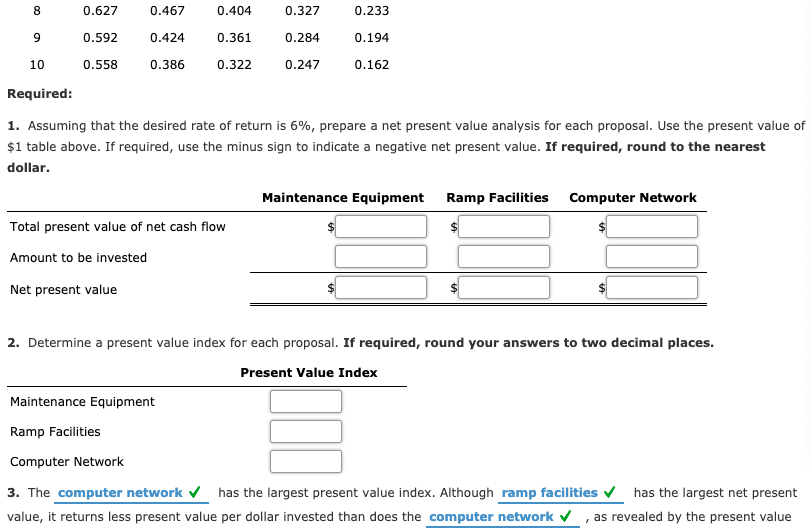

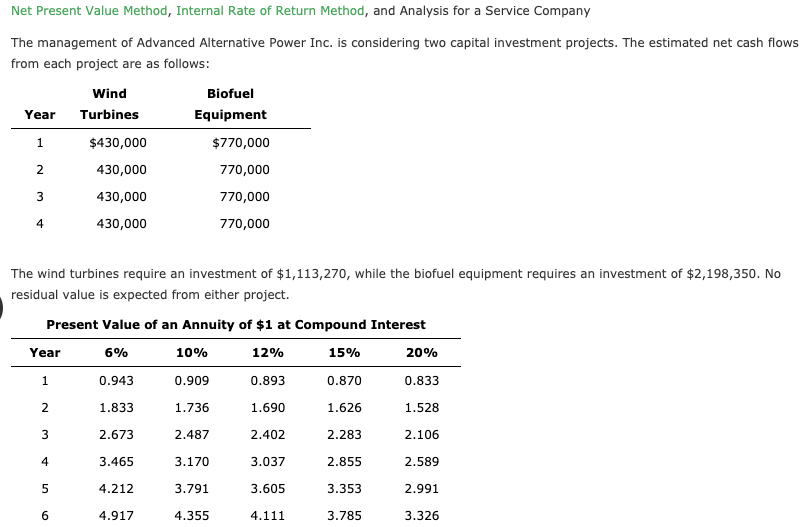
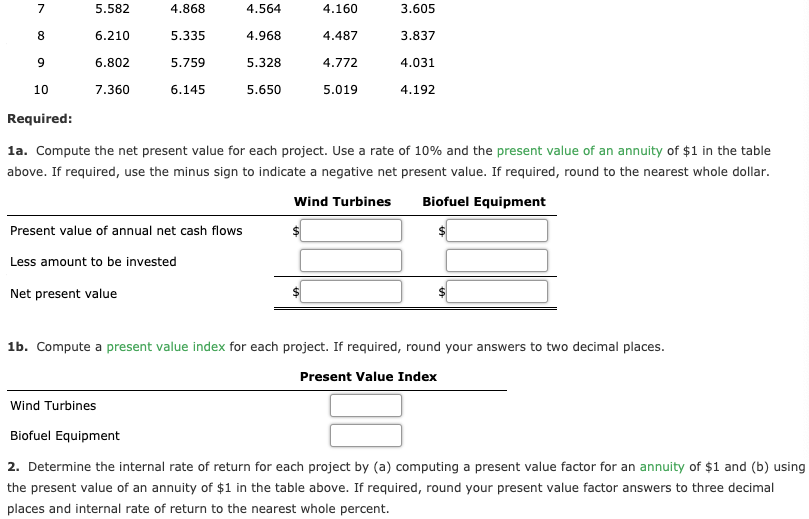
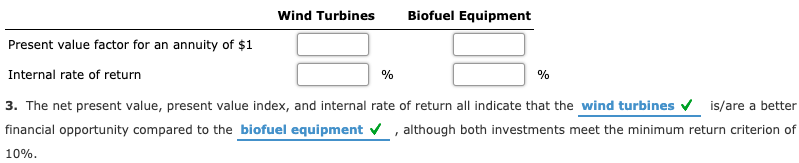
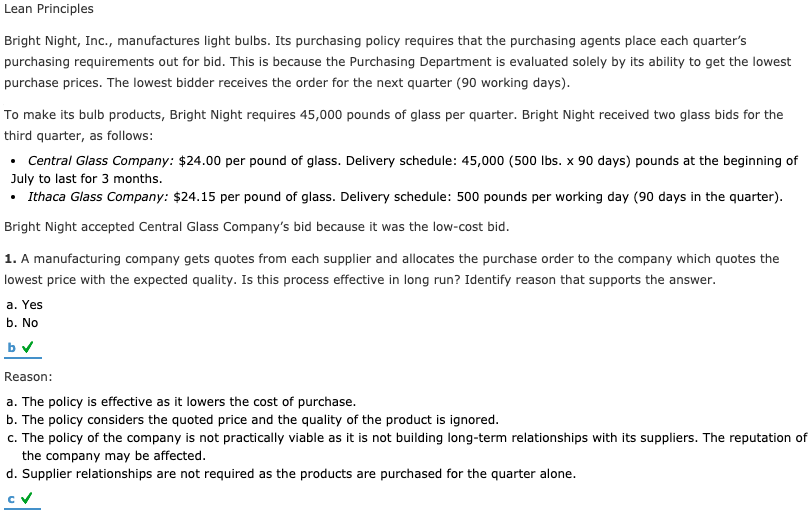
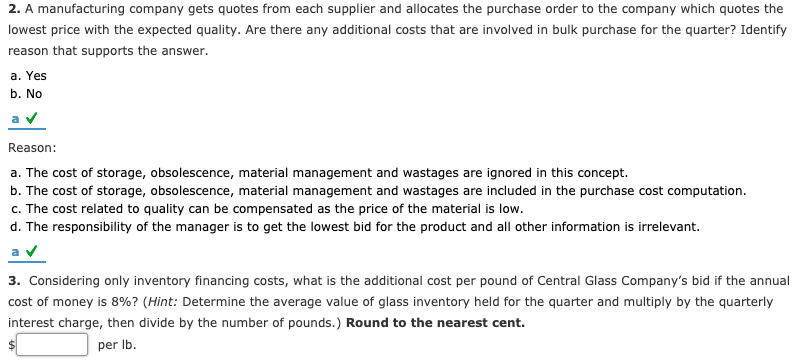
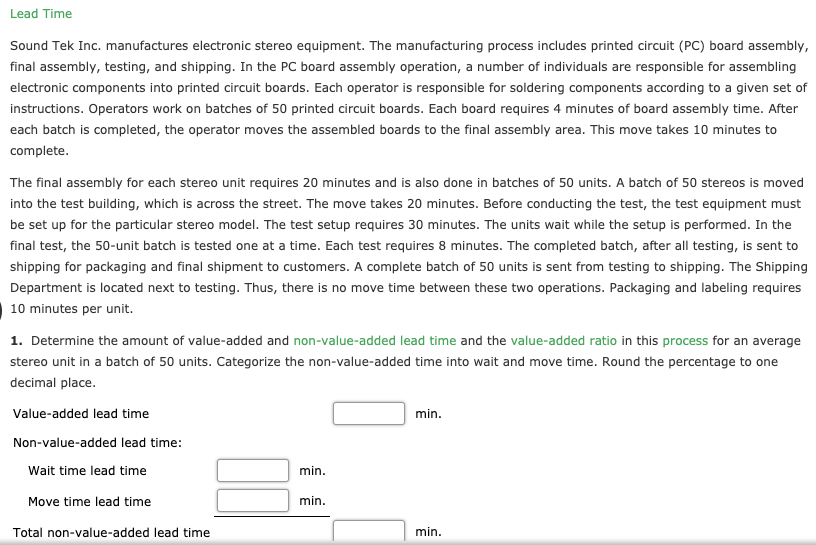
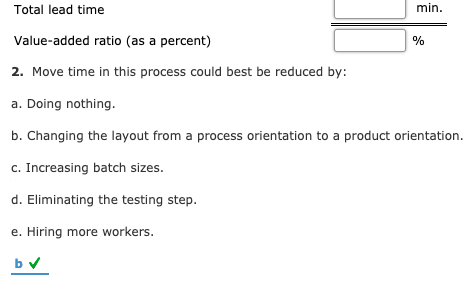
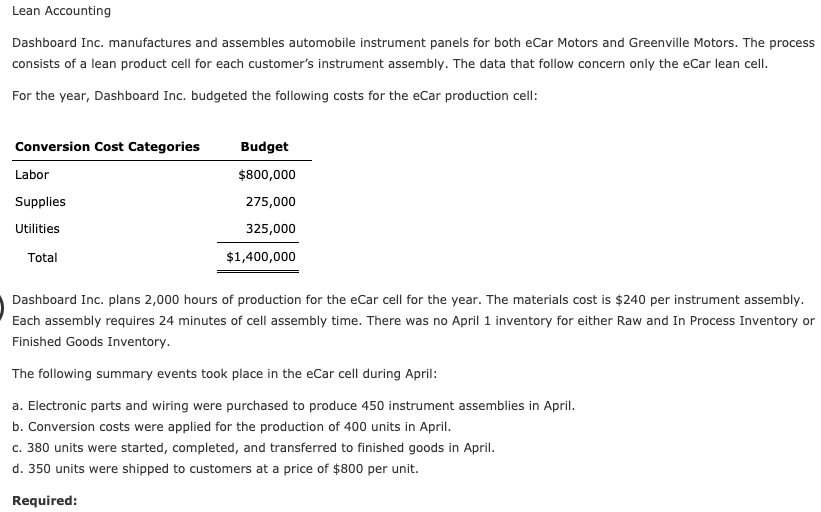
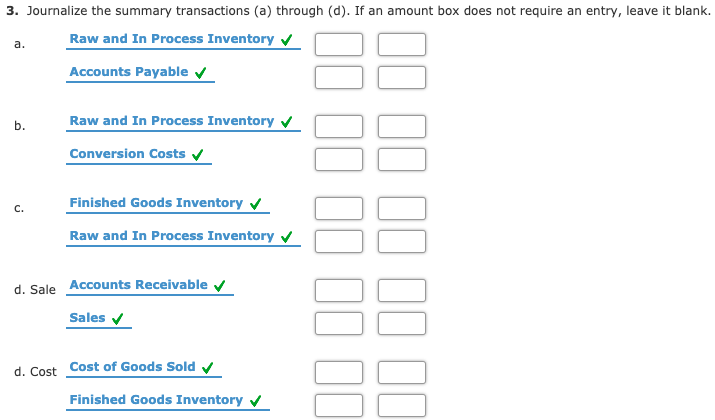
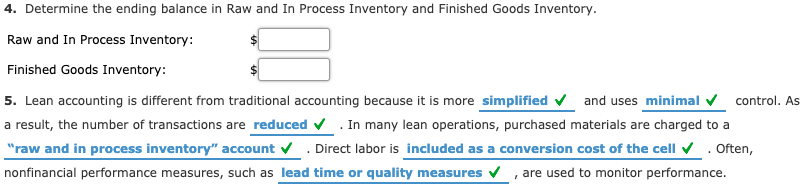
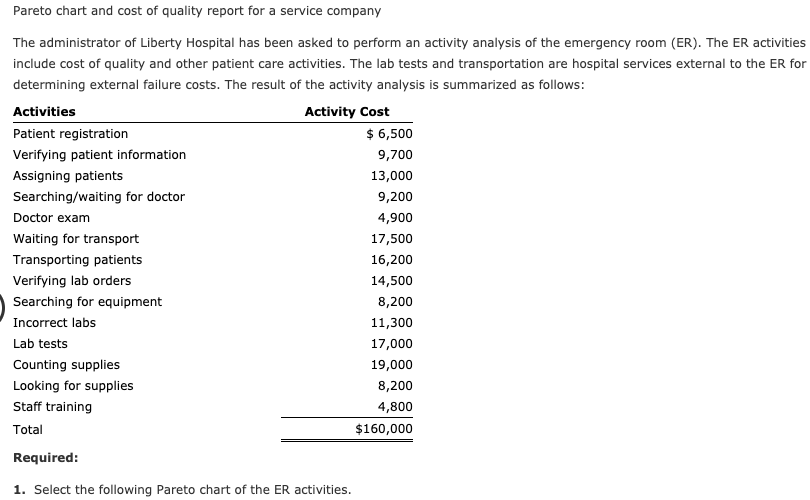
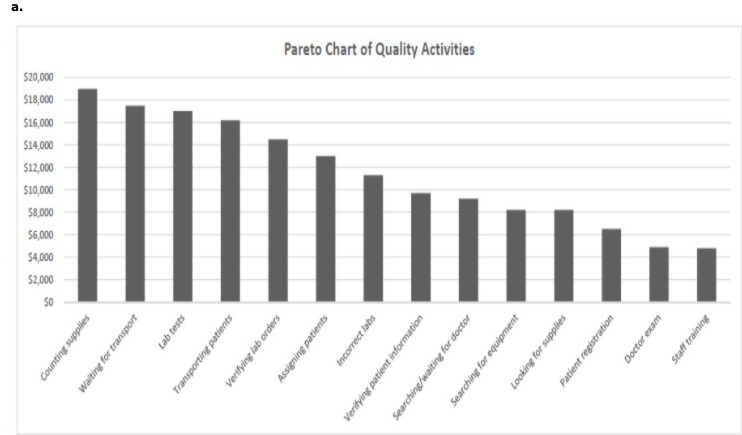
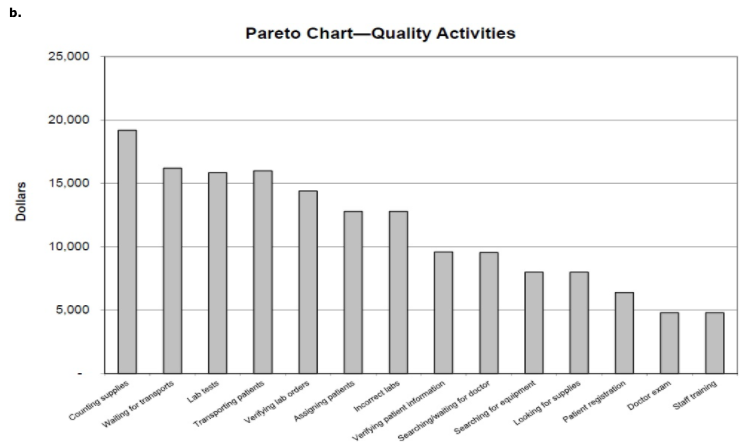
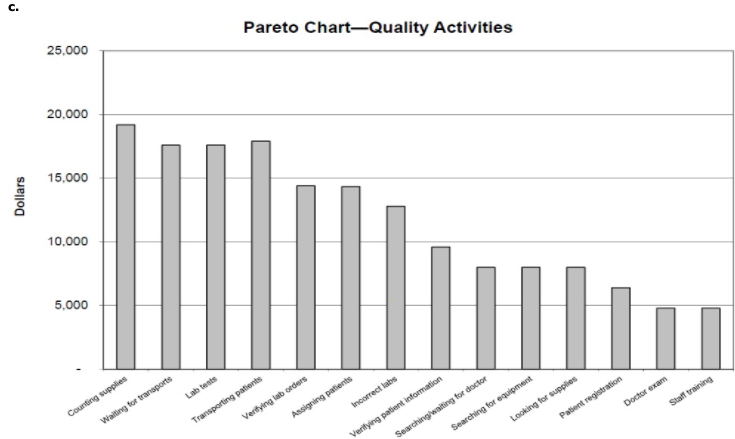
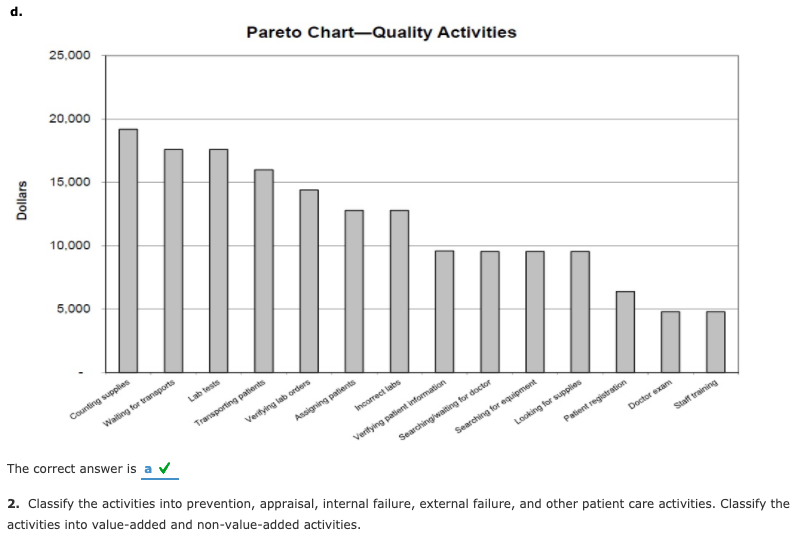
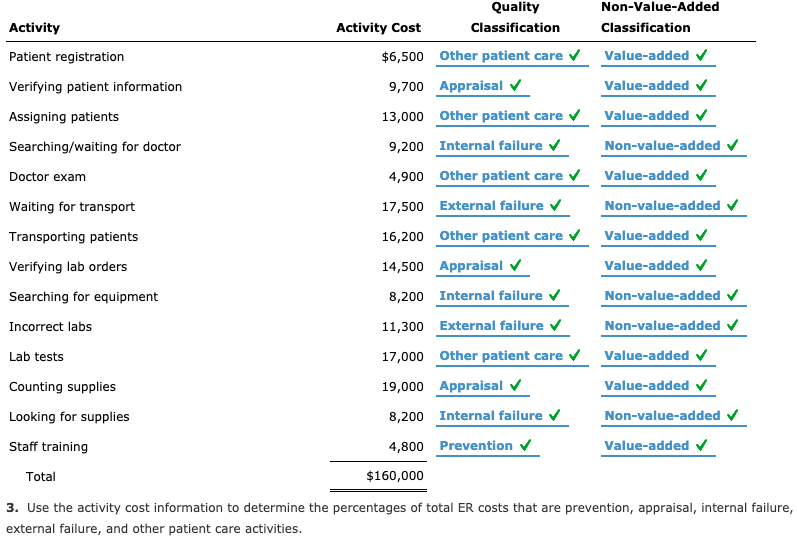
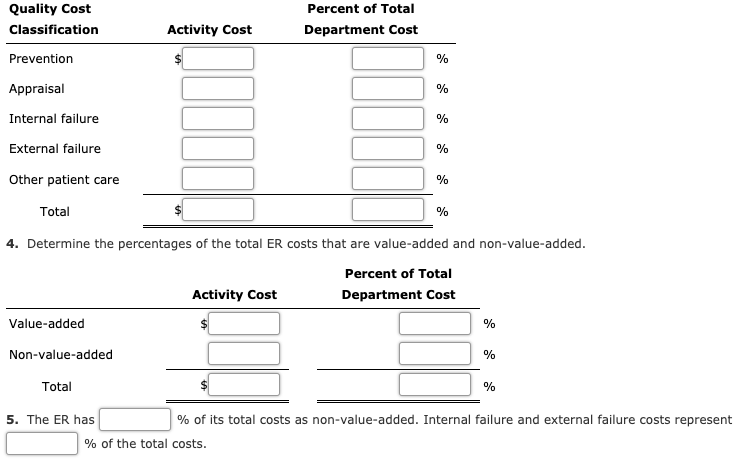
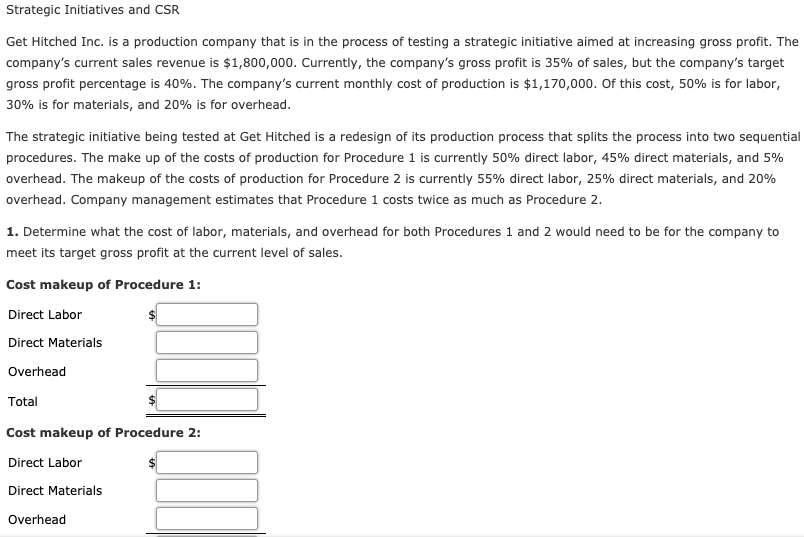
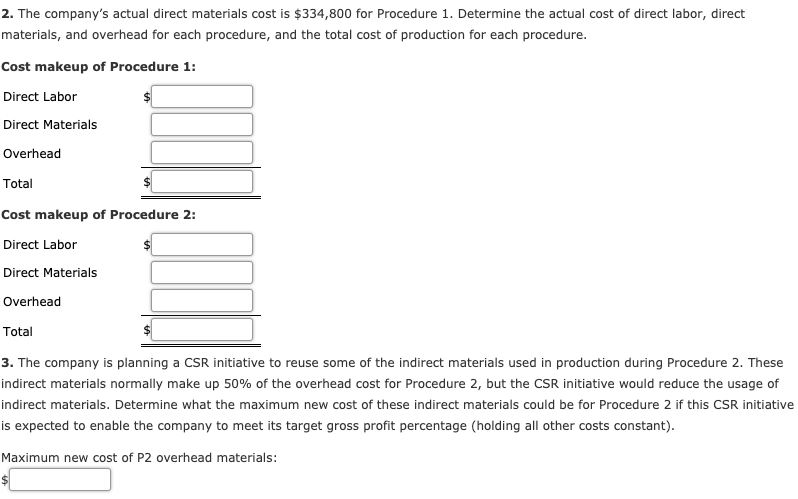
Year Plant Expansion Retail Store Expansion $120,000 1 $144,000 2 117,000 141,000 3 97,000 101,000 92,000 4 68,000 5 29,000 57,000 Total $483,000 $483,000 Each project requires an investment of $261,000. A rate of 10% has been selected for the net present value analysis. Present Value of $1 at Compound Interest Year 6% 10% 12% 15% 20% 0.943 0.909 0.893 0.870 0.833 2 0.890 0.826 0.797 0.756 0.694 3 0.840 0.751 0.712 0.658 0.579 4 0.792 0.683 0.636 0.572 0.482 5 0.747 0.621 0.567 0.497 0.402 6 0.705 0.564 0.507 0.432 0.335 7 0.665 0.513 0.452 0.376 0.279 8 0.627 0.467 0.404 0.327 0.233 9 0.592 0.424 0.361 0.284 0.194 10 0.558 0.386 0.322 0.247 0.162 Required: 1a. Compute the cash payback period for each project. Cash Payback Period Plant Expansion 2 years Retail Store Expansion 2 years 1b. Compute the net present value. Use the present value of $1 table above. If required, round to the nearest dollar. Plant Expansion Retail Store Expansion Total present value of net cash flow $ Less amount to be invested Net present value 2. Because of the timing of the receipt of the net cash flows, the plant expansion offers a higher net present value Net Present Value Method, Present Value Index, and Analysis for a service company Continental Railroad Company is evaluating three capital investment proposals by using the net present value method. Relevant data related to the proposals are summarized as follows: Maintenance Ramp Computer Equipment Facilities Network Amount to be invested $1,029,172 $660,338 $307,591 Annual net cash flows: Year 1 410,000 176,000 Year 2 381,000 349,000 295,000 266,000 236,000 121,000 88,000 Year 3 Year Present Value of $1 at Compound Interest 6% 10% 12% 15% 20% 0.943 0.909 0.893 0.870 0.833 1 2 0.890 0.826 0.797 0.756 0.694 3 0.840 0.751 0.712 0.658 0.579 4 0.792 0.683 0.636 0.572 0.482 5 0.747 0.621 0.567 0.497 0.402 6 0.705 0.564 0.507 0.432 0.335 7 0.665 0.513 0.452 0.376 0.279 8 0.627 0.467 0.404 0.327 0.233 9 0.592 0.424 0.361 0.284 0.194 10 0.558 0.386 0.322 0.247 0.162 Required: 1. Assuming that the desired rate of return is 6%, prepare a net present value analysis for each proposal. Use the present value of $1 table above. If required, use the minus sign to indicate a negative net present value. If required, round to the nearest dollar. Maintenance Equipment Ramp Facilities Computer Network Total present value of net cash flow Amount to be invested Net present value 2. Determine a present value index for each proposal. If required, round your answers to two decimal places. Present Value Index Maintenance Equipment Ramp Facilities Computer Network 3. The computer network has the largest present value index. Although ramp facilities has the largest net present value, it returns less present value per dollar invested than does the computer network, as revealed by the present value indexes. The present value index for the maintenance equipment is less than 1, indicating that it does not meet the minimum rate of return standard. Net Present Value Method, Internal Rate of Return Method, and Analysis for a Service Company The management of Advanced Alternative Power Inc. is considering two capital investment projects. The estimated net cash flows from each project are as follows: Wind Turbines Year Biofuel Equipment $770,000 1 $430,000 2 430,000 770,000 3 770,000 430,000 430,000 4 770,000 The wind turbines require an investment of $1,113,270, while the biofuel equipment requires an investment of $2,198,350. No residual value is expected from either project. Present Value of an Annuity of $1 at Compound Interest Year 6% 10% 12% 15% 20% 1 0.943 0.909 0.893 0.870 0.833 2 1.833 1.736 1.690 1.626 1.528 3 2.673 2.487 2.402 2.283 2.106 4 3.465 3.170 3.037 2.855 2.589 5 4.212 3.791 3.605 3.353 2.991 6 4.917 4.355 4.111 3.785 3.326 7 5.582 4.868 4.564 4.160 3.605 8 6.210 5.335 4.968 4.487 3.837 9 6.802 5.759 5.328 4.772 4.031 10 7.360 6.145 5.650 5.019 4.192 Required: 1a. Compute the net present value for each project. Use a rate of 10% and the present value of an annuity of $1 in the table above. If required, use the minus sign to indicate a negative net present value. If required, round to the nearest whole dollar. Wind Turbines Biofuel Equipment Present value of annual net cash flows $ Less amount to be invested Net present value 1b. Compute a present value index for each project. If required, round your answers to two decimal places. Present Value Index Wind Turbines Biofuel Equipment 2. Determine the internal rate of return for each project by (a) computing a present value factor for an annuity of $1 and (b) using the present value of an annuity of $1 in the table above. If required, round your present value factor answers to three decimal places and internal rate of return to the nearest whole percent. Wind Turbines Biofuel Equipment Present value factor for an annuity of $1 Internal rate of return % % 3. The net present value, present value index, and internal rate of return all indicate that the wind turbines is/are a better financial opportunity compared to the biofuel equipment , although both investments meet the minimum return criterion of 10%. Lean Principles Bright Night, Inc., manufactures light bulbs. Its purchasing policy requires that the purchasing agents place each quarter's purchasing requirements out for bid. This is because the Purchasing Department is evaluated solely by its ability to get the lowest purchase prices. The lowest bidder receives the order for the next quarter (90 working days). To make its bulb products, Bright Night requires 45,000 pounds of glass per quarter. Bright Night received two glass bids for the third quarter, as follows: Central Glass Company: $24.00 per pound of glass. Delivery schedule: 45,000 (500 lbs. x 90 days) pounds at the beginning of July to last for 3 months. Ithaca Glass Company: $24.15 per pound of glass. Delivery schedule: 500 pounds per working day (90 days in the quarter). Bright Night accepted Central Glass Company's bid because it was the low-cost bid. 1. A manufacturing company gets quotes from each supplier and allocates the purchase order to the company which quotes the lowest price with the expected quality. Is this process effective in long run? Identify reason that supports the answer. a. Yes b. No b Reason: a. The policy is effective as it lowers the cost of purchase. b. The policy considers the quoted price and the quality of the product is ignored. c. The policy of the company is not practically viable as it is not building long-term relationships with its suppliers. The reputation of the company may be affected. d. Supplier relationships are not required as the products are purchased for the quarter alone. 2. A manufacturing company gets quotes from each supplier and allocates the purchase order to the company which quotes the lowest price with the expected quality. Are there any additional costs that are involved in bulk purchase for the quarter? Identify reason that supports the answer. a. Yes b. No Reason: a. The cost of storage, obsolescence, material management and wastages are ignored in this concept. b. The cost of storage, obsolescence, material management and wastages are included in the purchase cost computation. c. The cost related to quality can be compensated as the price of the material is low. d. The responsibility of the manager is to get the lowest bid for the product and all other information is irrelevant. a 3. Considering only inventory financing costs, what is the additional cost per pound of Central Glass Company's bid if the annual cost of money is 8%? (Hint: Determine the average value of glass inventory held for the quarter and multiply by the quarterly interest charge, then divide by the number of pounds.) Round to the nearest cent. per lb. Lead Time Sound Tek Inc. manufactures electronic stereo equipment. The manufacturing process includes printed circuit (PC) board assembly, final assembly, testing, and shipping. In the PC board assembly operation, a number of individuals are responsible for assembling electronic components into printed circuit boards. Each operator is responsible for soldering components according to a given set of instructions. Operators work on batches of 50 printed circuit boards. Each board requires 4 minutes of board assembly time. After each batch is completed, the operator moves the assembled boards to the final assembly area. This move takes 10 minutes to complete. The final assembly for each stereo unit requires 20 minutes and is also done in batches of 50 units. A batch of 50 stereos is moved into the test building, which is across the street. The move takes 20 minutes. Before conducting the test, the test equipment must be set up for the particular stereo model. The test setup requires 30 minutes. The units wait while the setup is performed. In the final test, the 50-unit batch is tested one at a time. Each test requires 8 minutes. The completed batch, after all testing, is sent to shipping for packaging and final shipment to customers. A complete batch of 50 units is sent from testing to shipping. The Shipping Department is located next to testing. Thus, there is no move time between these two operations. Packaging and labeling requires 10 minutes per unit. 1. Determine the amount of value-added and non-value-added lead time and the value-added ratio in this process for an average stereo unit in a batch of 50 units. Categorize the non-value-added time into wait and move time. Round the percentage to one decimal place. Value-added lead time min. Non-value-added lead time: Wait time lead time min. Move time lead time min. Total non-value-added lead time min. Total lead time min. Value-added ratio (as a percent) % 2. Move time in this process could best be reduced by: a. Doing nothing. b. Changing the layout from a process orientation to a product orientation. C. Increasing batch sizes. d. Eliminating the testing step. e. Hiring more workers. b Lean Accounting Dashboard Inc. manufactures and assembles automobile instrument panels for both eCar Motors and Greenville Motors. The process consists of a lean product cell for each customer's instrument assembly. The data that follow concern only the eCar lean cell. For the year, Dashboard Inc. budgeted the following costs for the eCar production cell: Conversion Cost Categories Budget $800,000 Labor 275,000 Supplies Utilities 325,000 Total $1,400,000 Dashboard Inc. plans 2,000 hours of production for the eCar cell for the year. The materials cost is $240 per instrument assembly. Each assembly requires 24 minutes of cell assembly time. There was no April 1 inventory for either Raw and In Process Inventory or Finished Goods Inventory. The following summary events took place in the eCar cell during April: a. Electronic parts and wiring were purchased to produce 450 instrument assemblies in April. b. Conversion costs were applied for the production of 400 units in April. C. 380 units were started, completed, and transferred to finished goods in April. d. 350 units were shipped to customers at a price of $800 per unit. Required: 1. Determine the budgeted cell conversion cost per hour. per hour 2. Determine the budgeted cell conversion cost per unit. per unit 3. Journalize the summary transactions (a) through (d). If an amount box does not require an entry, leave it blank. Raw and In Process Inventory Accounts Payable a. b. Raw and In Process Inventory Conversion Costs C. Finished Goods Inventory Raw and In Process Inventory d. Sale Accounts Receivable Sales II II II d. Cost Cost of Goods Sold Finished Goods Inventory 4. Determine the ending balance in Raw and In Process Inventory and Finished Goods Inventory. Raw and In Process Inventory: Finished Goods Inventory: 5. Lean accounting is different from traditional accounting because it is more simplified and uses minimal control. As a result, the number of transactions are reduced . In many lean operations, purchased materials are charged to a "raw and in process inventory" account . Direct labor is included as a conversion cost of the cell . Often, nonfinancial performance measures, such as lead time or quality measures are used to monitor performance. Pareto chart and cost of quality report for a service company The administrator of Liberty Hospital has been asked to perform an activity analysis of the emergency room (ER). The ER activities include cost of quality and other patient care activities. The lab tests and transportation are hospital services external to the ER for determining external failure costs. The result of the activity analysis is summarized as follows: Activities Activity Cost Patient registration $ 6,500 Verifying patient information 9,700 Assigning patients 13,000 Searching/waiting for doctor 9,200 Doctor exam 4,900 Waiting for transport 17,500 Transporting patients 16,200 Verifying lab orders 14,500 Searching for equipment 8,200 Incorrect labs 11,300 Lab tests 17,000 Counting supplies 19,000 Looking for supplies 8,200 Staff training 4,800 Total $160,000 Required: 1. Select the following Pareto chart of the ER activities. a. $2,000 $4,000 $6,000 000's 000'01$ $12,000 $14,000 $16,000 $18,000 $20,000 SO Counting supplies Waiting for transport Lab tests Transporting patients Verifying lab orders Assigning patients incorrect labs Pareto Chart of Quality Activities Verifying patient information Searching/waiting for doctor Searching for equipment Looking for supplies Patient registration Doctor exam Staff training b. Pareto Chart-Quality Activities 25,000 20.000 15.000 Dollars 10,000 5.000 Labtests Incorrect tabs Doctor exam Staff training Counting supplies Waiting for transports Transporting patients Verifying lab orders Assigning patients Patient registration Verifying patient Information Searching waiting for doctor Searching for equipment Looking for supplies c. Pareto Chart-Quality Activities 25.000 20.000 15.000 Dollars 10.000 5.000 Labtests Incorrect labs Doctorem Start training Counting supplies Transporting patients Waiting for transports Verifying lab orders Assigning patients Looking for supplies Patient registration Searching for equipment Verlying patient information Searching waiting for doctor d. Pareto ChartQuality Activities 25,000 20,000 15,000 Dollars 10.000 5.000 Labtests Incorrect labs Doctor exam Staff training Counting supplies Waiting for transports Transporting patients Vertying lab orders Assigning patients The correct answer is a Veritying patient information Searching waiting for doctor Searching for equipment Looking for supplies Patient registration 2. Classify the activities into prevention, appraisal, internal failure, external failure, and other patient care activities. Classify the activities into value-added and non-value-added activities. Activity Patient registration Verifying patient information Assigning patients Searching/waiting for doctor Doctor exam Waiting for transport Transporting patients Verifying lab orders Searching for equipment Incorrect labs Quality Non-Value Added Activity Cost Classification Classification $6,500 Other patient care Value-added 9,700 Appraisal Value-added 13,000 Other patient care Value-added 9,200 Internal failure Non-value-added 4,900 Other patient care Value-added 17,500 External failure Non-value-added 16,200 Other patient care Value-added 14,500 Appraisal Value-added 8,200 Internal failure Non-value-added 11,300 External failure Non-value-added 17,000 Other patient care Value-added 19,000 Appraisal Value-added 8,200 Internal failure Non-value-added 4,800 Prevention Value-added $160,000 Lab tests Counting supplies Looking for supplies Staff training Total 3. Use the activity cost information to determine the percentages of total ER costs that are prevention, appraisal, internal failure, external failure, and other patient care activities. Quality Cost Classification Percent of Total Department Cost Activity Cost Prevention % Appraisal % Internal failure % External failure % Other patient care % Total % 4. Determine the percentages of the total ER costs that are value-added and non-value-added. Percent of Total Department Cost Activity Cost Value-added % Non-value-added % Total % 5. The ER has % of its total costs as non-value-added. Internal failure and external failure costs represent % of the total costs. Strategic Initiatives and CSR Get Hitched Inc. is a production company that is in the process of testing a strategic initiative aimed at increasing gross profit. The company's current sales revenue is $1,800,000. Currently, the company's gross profit is 35% of sales, but the company's target gross profit percentage is 40%. The company's current monthly cost of production is $1,170,000. Of this cost, 50% is for labor, 30% is for materials, and 20% is for overhead. The strategic initiative being tested at Get Hitched is a redesign of its production process that splits the process into two sequential procedures. The make up of the costs of production for Procedure 1 is currently 50% direct labor, 45% direct materials, and 5% overhead. The makeup of the costs of production for Procedure 2 is currently 55% direct labor, 25% direct materials, and 20% overhead. Company management estimates that Procedure 1 costs twice as much as Procedure 2. 1. Determine what the cost of labor, materials, and overhead for both Procedures 1 and 2 would need to be the company to meet its target gross profit at the current level of sales. Cost makeup of Procedure 1: Direct Labor Direct Materials Overhead Total Cost makeup of Procedure 2: Direct Labor Direct Materials Overhead 2. The company's actual direct materials cost is $334,800 for Procedure 1. Determine the actual cost of direct labor, direct materials, and overhead for each procedure, and the total cost of production for each procedure. Cost makeup of Procedure 1: Direct Labor Direct Materials Overhead Total Cost makeup of Procedure 2: Direct Labor Direct Materials Overhead Total 3. The company is planning a CSR initiative to reuse some of the indirect materials used in production during Procedure 2. These indirect materials normally make up 50% of the overhead cost for Procedure 2, but the CSR initiative would reduce the usage of indirect materials. Determine what the maximum new cost of these indirect materials could be for Procedure 2 if this CSR initiative is expected to enable the company to meet its target gross profit percentage (holding all other costs constant). Maximum new cost of P2 overhead materials
Step by Step Solution
There are 3 Steps involved in it

Get step-by-step solutions from verified subject matter experts