Question: Category Year Make Model Zip Code Edmunds Style Cars.com Trim Cars.com MSRP Combined Miles per Gallon Total Mileage after 5 Years Kelly Blue Book Category
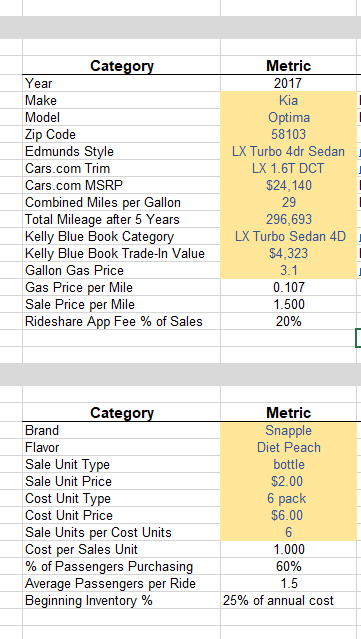
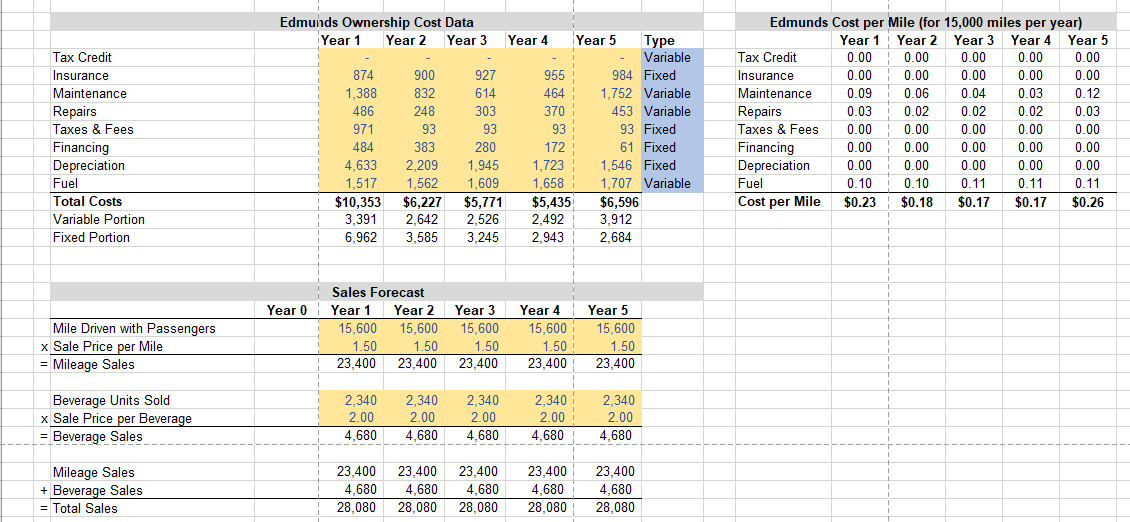
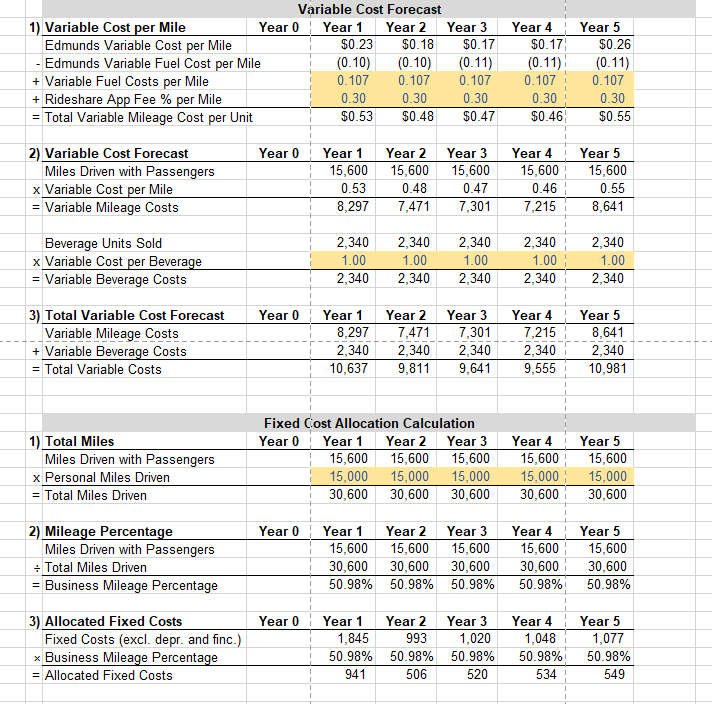
Category Year Make Model Zip Code Edmunds Style Cars.com Trim Cars.com MSRP Combined Miles per Gallon Total Mileage after 5 Years Kelly Blue Book Category Kelly Blue Book Trade-In Value Gallon Gas Price Gas Price per Mile Sale Price per Mile Rideshare App Fee % of Sales Metric 2017 Kia Optima 58103 LX Turbo 4dr Sedan LX 1.6T DCT $24,140 29 296,693 LX Turbo Sedan 4D $4,323 3.1 0.107 1.500 20% Category Brand Flavor Sale Unit Type Sale Unit Price Cost Unit Type Cost Unit Price Sale Units per Cost Units Cost per Sales Unit % of Passengers Purchasing Average Passengers per Ride Beginning Inventory % Metric Snapple Diet Peach bottle $2.00 6 pack $6.00 6 1.000 60% 1.5 25% of annual cost Edmunds Ownership Cost Data Year 1 Year 2 Year 3 0.00 0.00 0.00 0.00 Tax Credit Insurance Maintenance Repairs Taxes & Fees Financing Depreciation Fuel Total Costs Variable Portion Fixed Portion 874 1,388 486 971 484 4,633 1,517 $10,353 3,391 6,962 900 832 248 93 383 2,209 1,562 $6,227 2,642 3,585 927 614 303 93 280 1,945 1,609 $5,771 2.526 3.245 Year 4 Year 5 Type Variable 955 984 Fixed 464 1,752 Variable 370 453 Variable 93 93 Fixed 172 61 Fixed 1,723 1,546 Fixed 1,658 1,707 Variable $5,435 $6,596 2.492 3,912 2.943 2,684 Edmunds Cost per Mile (for 15,000 miles per year) Year 1 Year 2 Year 3 Year 4 Year 5 Tax Credit 0.00 Insurance 0.00 0.00 0.00 0.00 0.00 Maintenance 0.09 0.06 0.04 0.03 0.12 Repairs 0.03 0.02 0.02 0.02 0.03 Taxes & Fees 0.00 0.00 0.00 0.00 0.00 Financing 0.00 0.00 0.00 0.00 0.00 Depreciation 0.00 0.00 0.00 0.00 0.00 Fuel 0.10 0.10 0.11 0.11 0.11 Cost per Mile $0.23 $0.18 $0.17 $0.17 $0.26 1 Year 0 Sales Forecast Year 1 Year 2 15,600 1.50 1.50 23,400 23,400 Mile Driven with Passengers x Sale Price per Mile = Mileage Sales 15,600 Year 3 15,600 1.50 23,400 Year 4 15,600 1.50 23,400 Year 5 15,600 1.50 23,400 2,340 Beverage Units Sold x Sale Price per Beverage = Beverage Sales 2,340 2.00 4.680 2,340 2.00 4.680 2,340 2.00 4,680 2,340 2.00 4,680 2.00 4,680 Mileage Sales + Beverage Sales = Total Sales 23,400 4.680 28,080 23.400 4,680 28,080 23,400 4.680 28.080 23.400 4.680 28,080 23,400 4,680 28,080 Variable Cost Forecast 1) Variable Cost per Mile Year 0 Year 1 Year 2 Year 3 Edmunds Variable Cost per Mile $0.23 $0.18 $0.17 - Edmunds Variable Fuel Cost per Mile (0.10) (0.10) (0.11) + Variable Fuel Costs per Mile 0.107 0.107 0.107 + Rideshare App Fee % per Mile 0.30 0.30 0.30 = Total Variable Mileage Cost per Unit $0.53 $0.48 $0.47 Year 4 $0.17 (0.11) 0.107 0.30 $0.46 Year 5 $0.26 (0.11) 0.107 0.30 $0.55 Year 0 2) Variable Cost Forecast Miles Driven with Passengers x Variable Cost per Mile = Variable Mileage Costs Year 1 15,600 0.53 8,297 Year 2 15,600 0.48 7,471 Year 3 15,600 0.47 7,301 Year 4 15,600 0.46 7,215 Year 5 15,600 0.55 8,641 Beverage Units Sold x Variable Cost per Beverage = Variable Beverage Costs 2,340 1.00 2,340 2,340 1.00 2,340 2,340 1.00 2,340 2,340 1.00 2,340 2,340 1.00 2,340 = Year 0 3) Total Variable Cost Forecast Variable Mileage Costs + Variable Beverage Costs = Total Variable Costs Year 1 8,297 2,340 10,637 Year 2 7,471 2,340 9,811 Year 3 7,301 2,340 9,641 Year 4 7,215 2,340 9,555 Year 5 8,641 2,340 10,981 1) Total Miles Miles Driven with Passengers x Personal Miles Driven = Total Miles Driven Fixed Cost Allocation Calculation Year 0 Year 1 Year 2 Year 3 15,600 15,600 15,600 15,000 15,000 15,000 30,600 30,600 30,600 Year 4 15,600 15,000 30,600 Year 5 15,600 15,000 30,600 Year 0 2) Mileage Percentage Miles Driven with Passengers Total Miles Driven = Business Mileage Percentage Year 1 Year 2 Year 3 15,600 15,600 15,600 30,600 30,600 30,600 50.98% 50.98% 50.98% Year 4 15,600 30,600 50.98% Year 5 15,600 30,600 50.98% Year 0 3) Allocated Fixed Costs Fixed Costs (excl. depr. and finc.)


