

Question: cause and their possible solutions check the example in these photo, this is textbook that chapter part Scenario: Read the example of the ocean inbound
cause and their possible solutions
check the example in these photo, this is textbook that chapter part
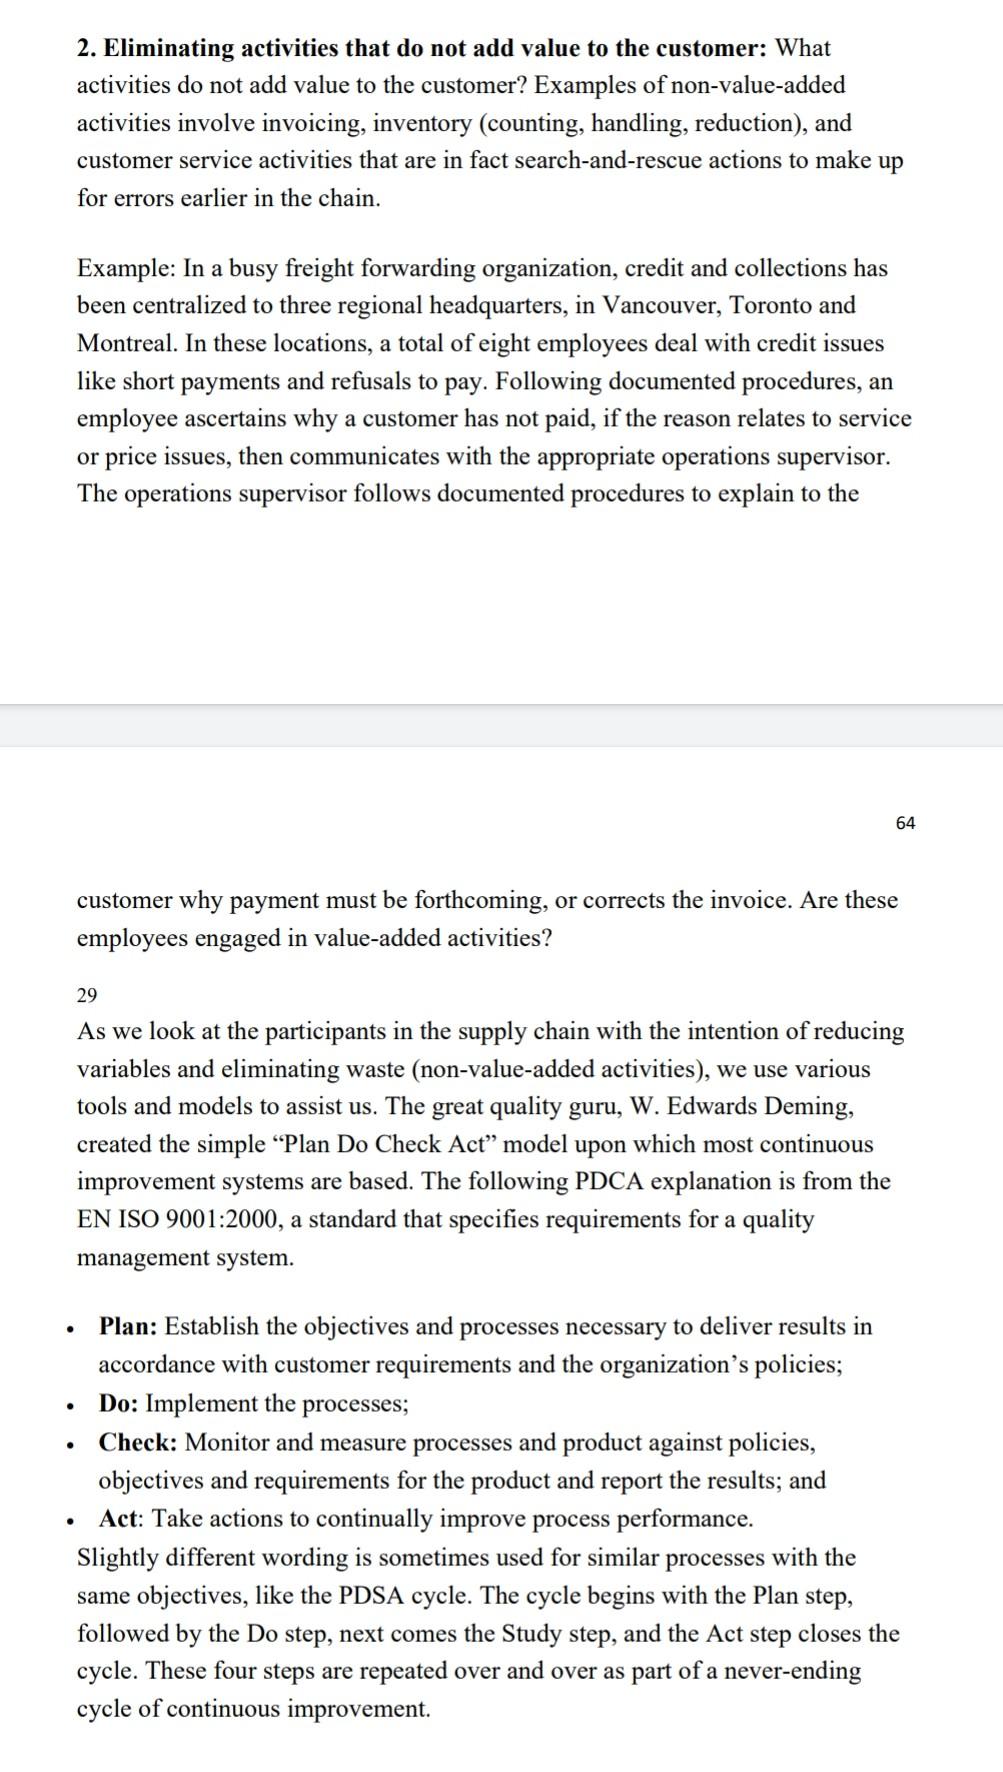
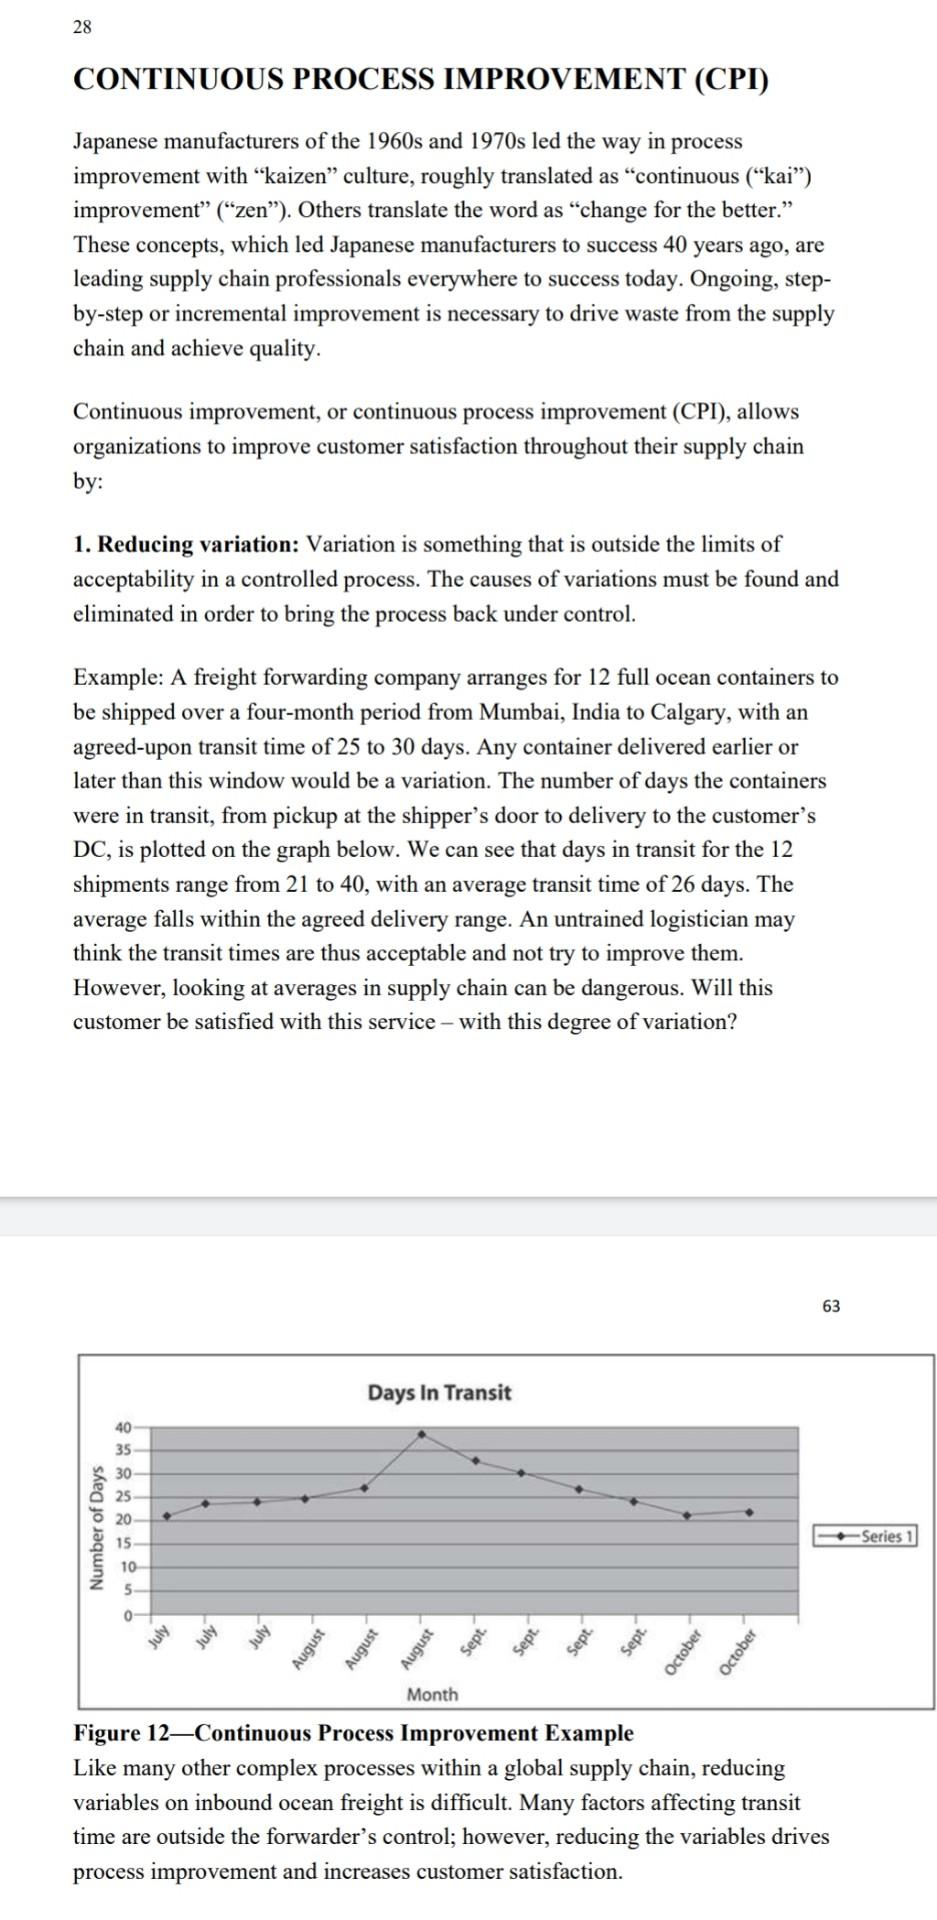
Scenario: Read the example of the ocean inbound containers from Mumbai, India to Calgary, Canada (Supply Chain Management and Marketing textbook; Logistics and Supply Chain Management, Chapter 3). Identify causes of the variations and potential actions you might take to reduce the variation (eliminate the cause of the delay). Causes of the Variation Possible Preventive Actions To eliminate the identified variation, present the PDCA model and identify specific action that need to be implemented according to each step in this model. 28 CONTINUOUS PROCESS IMPROVEMENT (CPI) Japanese manufacturers of the 1960s and 1970s led the way in process improvement with kaizen culture, roughly translated as "continuous ("kai) improvement (zen). Others translate the word as change for the better. These concepts, which led Japanese manufacturers to success 40 years ago, are leading supply chain professionals everywhere to success today. Ongoing, step- by-step or incremental improvement is necessary to drive waste from the supply chain and achieve quality. Continuous improvement, or continuous process improvement (CPI), allows organizations to improve customer satisfaction throughout their supply chain by: 1. Reducing variation: Variation is something that is outside the limits of acceptability in a controlled process. The causes of variations must be found and eliminated in order to bring the process back under control. Example: A freight forwarding company arranges for 12 full ocean containers to be shipped over a four-month period from Mumbai, India to Calgary, with an agreed-upon transit time of 25 to 30 days. Any container delivered earlier or later than this window would be a variation. The number of days the containers were in transit, from pickup at the shipper's door to delivery to the customer's DC, is plotted on the graph below. We can see that days in transit for the 12 shipments range from 21 to 40, with an average transit time of 26 days. The average falls within the agreed delivery range. An untrained logistician may think the transit times are thus acceptable and not try to improve them. However, looking at averages in supply chain can be dangerous. Will this customer be satisfied with this service - with this degree of variation? 63 Days In Transit 40 35 30 25 20 Number of Days 15 -Series 1 10 5 0 July August August August Sept. Sept. October October Month Figure 12Continuous Process Improvement Example Like many other complex processes within a global supply chain, reducing variables on inbound ocean freight is difficult. Many factors affecting transit time are outside the forwarder's control; however, reducing the variables drives process improvement and increases customer satisfaction. 2. Eliminating activities that do not add value to the customer: What activities do not add value to the customer? Examples of non-value-added activities involve invoicing, inventory (counting, handling, reduction), and customer service activities that are in fact search-and-rescue actions to make up for errors earlier in the chain. Example: In a busy freight forwarding organization, credit and collections has been centralized to three regional headquarters, in Vancouver, Toronto and Montreal. In these locations, a total of eight employees deal with credit issues like short payments and refusals to pay. Following documented procedures, an employee ascertains why a customer has not paid, if the reason relates to service or price issues, then communicates with the appropriate operations supervisor. The operations supervisor follows documented procedures to explain to the 64 customer why payment must be forthcoming, or corrects the invoice. Are these employees engaged in value-added activities? 29 As we look at the participants in the supply chain with the intention of reducing variables and eliminating waste (non-value-added activities), we use various tools and models to assist us. The great quality guru, W. Edwards Deming, created the simple Plan Do Check Act" model upon which most continuous improvement systems are based. The following PDCA explanation is from the EN ISO 9001:2000, a standard that specifies requirements for a quality management system. . . Plan: Establish the objectives and processes necessary to deliver results in accordance with customer requirements and the organization's policies; Do: Implement the processes; Check: Monitor and measure processes and product against policies, objectives and requirements for the product and report the results; and Act: Take actions to continually improve process performance. Slightly different wording is sometimes used for similar processes with the same objectives, like the PDSA cycle. The cycle begins with the Plan step, followed by the Do step, next comes the Study step, and the Act step closes the cycle. These four steps are repeated over and over as part of a never-ending cycle of continuous improvement
Step by Step Solution
There are 3 Steps involved in it
1 Expert Approved Answer
Step: 1 Unlock

Question Has Been Solved by an Expert!
Get step-by-step solutions from verified subject matter experts
Step: 2 Unlock
Step: 3 Unlock