

Question: ccp.instructure.com Area DQuestion 10 1 pts To show changes over time, you would use a..chart. O Line O Column Bar O Pie D Question 11
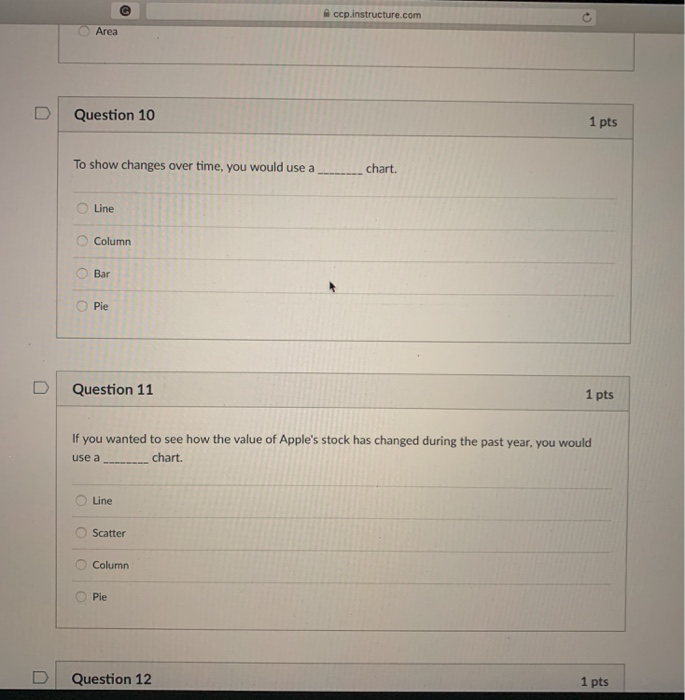
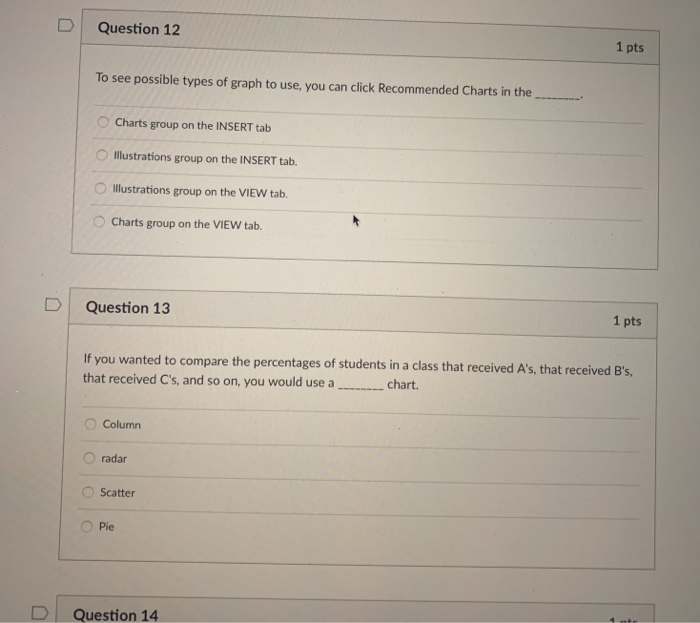
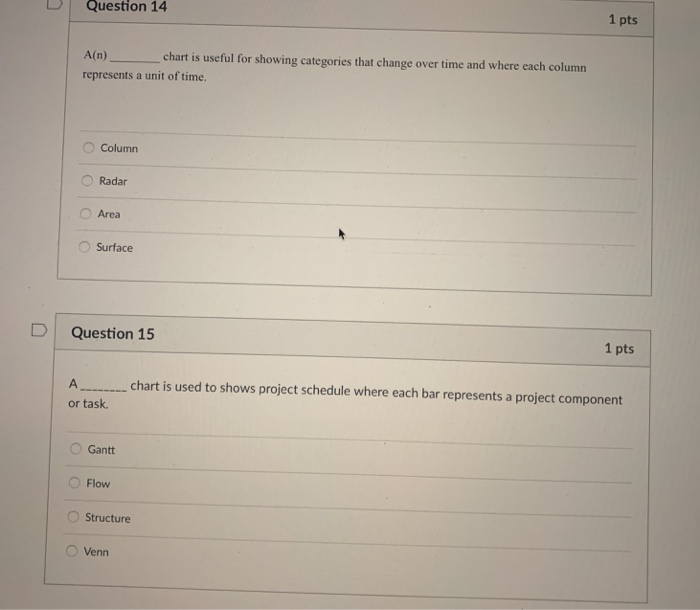
ccp.instructure.com Area DQuestion 10 1 pts To show changes over time, you would use a..chart. O Line O Column Bar O Pie D Question 11 1 pts If you wanted to see how the value of Apple's stock has changed during the past year, you would use aC O Line O Scatter O Column O Pie chart. D | Question 12 1 pts D Question 12 1 pts To see possible types of graph to use, you can click Recommended Charts in the Charts group on the INSERT tab Hlustrations group on the INSERT tab. O Illustrations group on the VIEW tab. Charts group on the VIEW tab. D Question 13 1 pts nted to compare the percentaes of students in a class that received A's, that received B's, that received C's, and so on, you would use a chart. O Column O radar O Scatter Pie Question 14 DQuestion 14 1 pts An) chart is useful for showing categories that change over time and where each column represents a unit of time. O Column O Radar O Area Surface D Question 15 1 pts chart is used to shows project schedule where each bar represents a project component or task. O Gantt O Flow O Structure Venn
Step by Step Solution
There are 3 Steps involved in it

Get step-by-step solutions from verified subject matter experts