

Question: c@D. 3:44 PM sites.google.com ill AT&T 3. Linear Regression (10 Points) In some engineering experiments, a set of mcasurements is taken to be plotted and
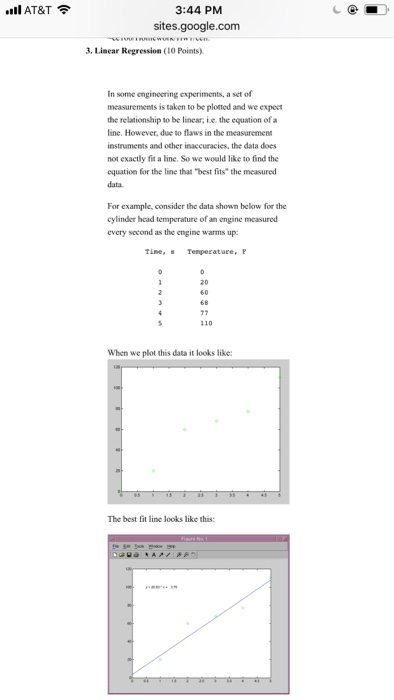
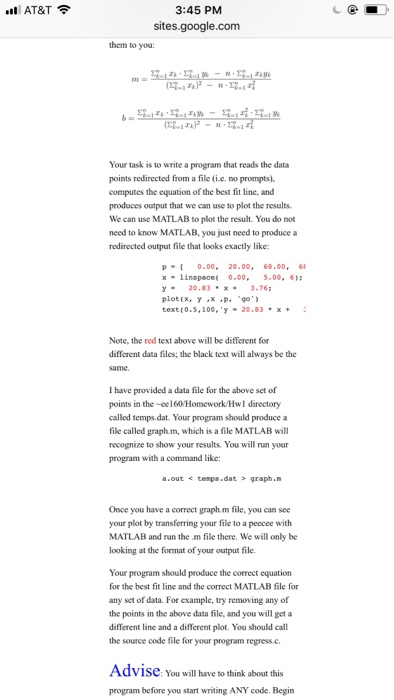
c@D. 3:44 PM sites.google.com ill AT&T 3. Linear Regression (10 Points) In some engineering experiments, a set of mcasurements is taken to be plotted and we expect the relationship to be limear, ie. the equation ofa line. However, due to flaws in the measuremens instruments and other inaccuracies, the data does not exactly fit a line. So we would like to find the equation for the line that "best fits" the measured data For example, consider the data shown below for the cylinder head temperature of an engine every second as the engine warms up: measured Tine,sTenperature, P 20 60 110 When we plot this data it looks like: The best fit line looks like this
Step by Step Solution
There are 3 Steps involved in it

Get step-by-step solutions from verified subject matter experts