

Question: C,D, and E please It is known from Phase I data that a process has the average defects rate of 40 defects per 1000 boards.
C,D, and E please
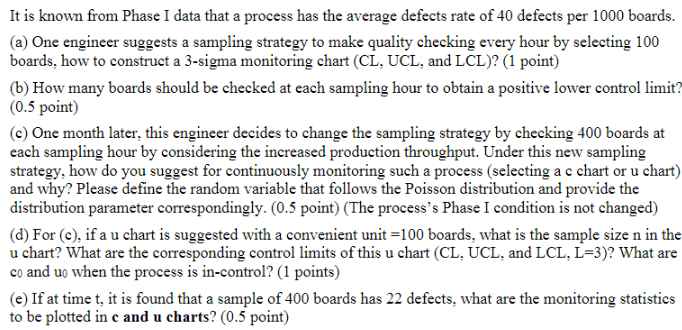
It is known from Phase I data that a process has the average defects rate of 40 defects per 1000 boards. (a) One engineer suggests a sampling strategy to make quality checking every hour by selecting 100 boards, how to construct a 3-sigma monitoring chart (CL, UCL, and LCL)? (1 point) (b) How many boards should be checked at each sampling hour to obtain a positive lower control limit? (0.5 point) (c) One month later, this engineer decides to change the sampling strategy by checking 400 boards at each sampling hour by considering the increased production throughput. Under this new sampling strategy, how do you suggest for continuously monitoring such a process (selecting a c chart or u chart) and why? Please define the random variable that follows the Poisson distribution and provide the distribution parameter correspondingly. ( 0.5 point) (The process's Phase I condition is not changed) (d) For (c), if a u chart is suggested with a convenient unit =100 boards, what is the sample size n in the u chart? What are the corresponding control limits of this u chart (CL, UCL, and LCL, L=3)? What are c0 and u0 when the process is in-control? (1 points) (e) If at time t, it is found that a sample of 400 boards has 22 defects, what are the monitoring statistics to be plotted in c and u charts? ( 0.5 point)
Step by Step Solution
There are 3 Steps involved in it

Get step-by-step solutions from verified subject matter experts