

Question: CD file OffRates a. Use these data to develop an estimated regression equation that could be used to pre- dict the price of a
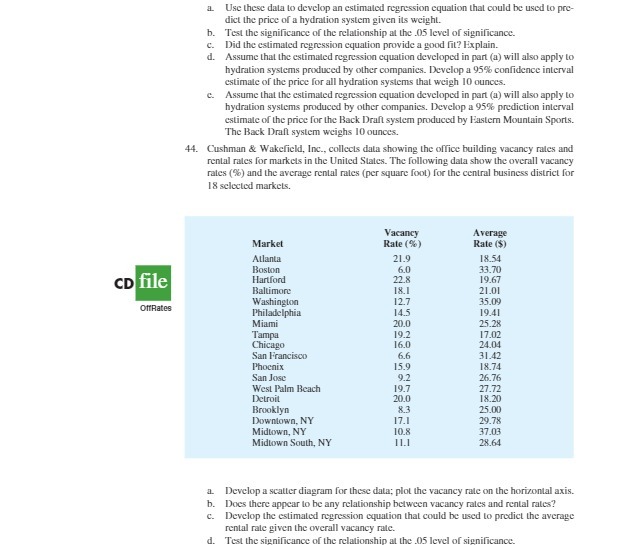
CD file OffRates a. Use these data to develop an estimated regression equation that could be used to pre- dict the price of a hydration system given its weight. b. Test the significance of the relationship at the .05 level of significance. c. Did the estimated regression equation provide a good fit? Explain. d. Assume that the estimated regression equation developed in part (a) will also apply to hydration systems produced by other companies. Develop a 95% confidence interval estimate of the price for all hydration systems that weigh 10 ounces. c. Assume that the estimated regression equation developed in part (a) will also apply to hydration systems produced by other companies. Develop a 95% prediction interval estimate of the price for the Back Draft system produced by Eastern Mountain Sports. The Back Draft system weighs 10 ounces. 44. Cushman & Wakefield, Inc., collects data showing the office building vacancy rates and rental rates for markets in the United States. The following data show the overall vacancy rates (%) and the average rental rates (per square foot) for the central business district for 18 selected markets. Market Vacancy Rate (%) Average Rate ($) Atlanta Boston Hartford Baltimore 21.9 18.54 6.0 33.70 22.8 19.67 18.1 21.01 Washington 12.7 35.09 Philadelphia 14.5 19.41 Miami 20.0 25.28 Tampa 19.2 17.02 Chicago 16.0 24.04 San Francisco 6.6 31.42 Phoenix 15.9 18.74 San Jose 9.2 26.76 West Palm Beach 19.7 27.72 Detroit 20.0 18.20 Brooklyn 8.3 25.00 Downtown, NY 17.1 29.78 Midtown, NY 10.8 37.03 Midtown South, NY 11.1 28.64 a. Develop a scatter diagram for these data; plot the vacancy rate on the horizontal axis. b. Does there appear to be any relationship between vacancy rates and rental rates? c. Develop the estimated regression equation that could be used to predict the average rental rate given the overall vacancy rate. d. Test the significance of the relationship at the .05 level of significance.
Step by Step Solution
There are 3 Steps involved in it

Get step-by-step solutions from verified subject matter experts