

Question: CENGAGE MINDTAP Homework (Ch 05) Back to Assignment Tools Attempts Average / 4 5. The variation in elasticity and total revenue along a demand curve
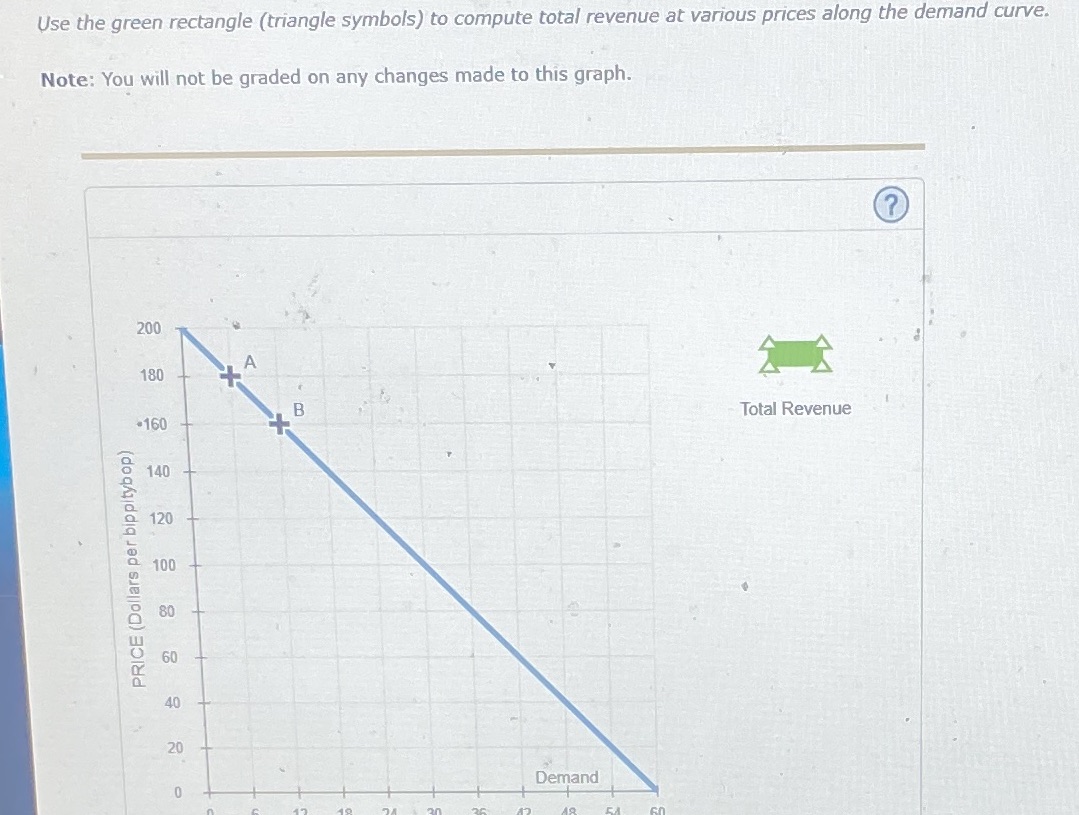

CENGAGE MINDTAP Homework (Ch 05) Back to Assignment Tools Attempts Average / 4 5. The variation in elasticity and total revenue along a demand curve PS The following graph shows the daily demand curve for bippitybops in Miami. ps Use the green rectangle (triangle symbols) to compute total revenue at various prices along the demand curve. Is Note: You will not be graded on any changes made to this graph. iples of ?Use the green rectangle (triangle symbols) to compute total revenue at various prices along the demand curve. Note: You will not be graded on any changes made to this graph. 200 A 180 Total Revenue .160 140 120 100 PRICE (Dollars per bippitybop) 80 60 40 20 Demand 0s of Calculate the daily total revenue when the market price is $200, $180, $160, $140, $120, $100, $80, and $60 per bippitybop. Then, use the green point (triangle symbol) to plot the daily total revenue against quantity corresponding to these market prices on the following graph
Step by Step Solution
There are 3 Steps involved in it

Get step-by-step solutions from verified subject matter experts