

Question: Central Limit Theorem in Practice. The figure below presents four histograms, labeled with upper case letters A through D. One of these graphs displays the
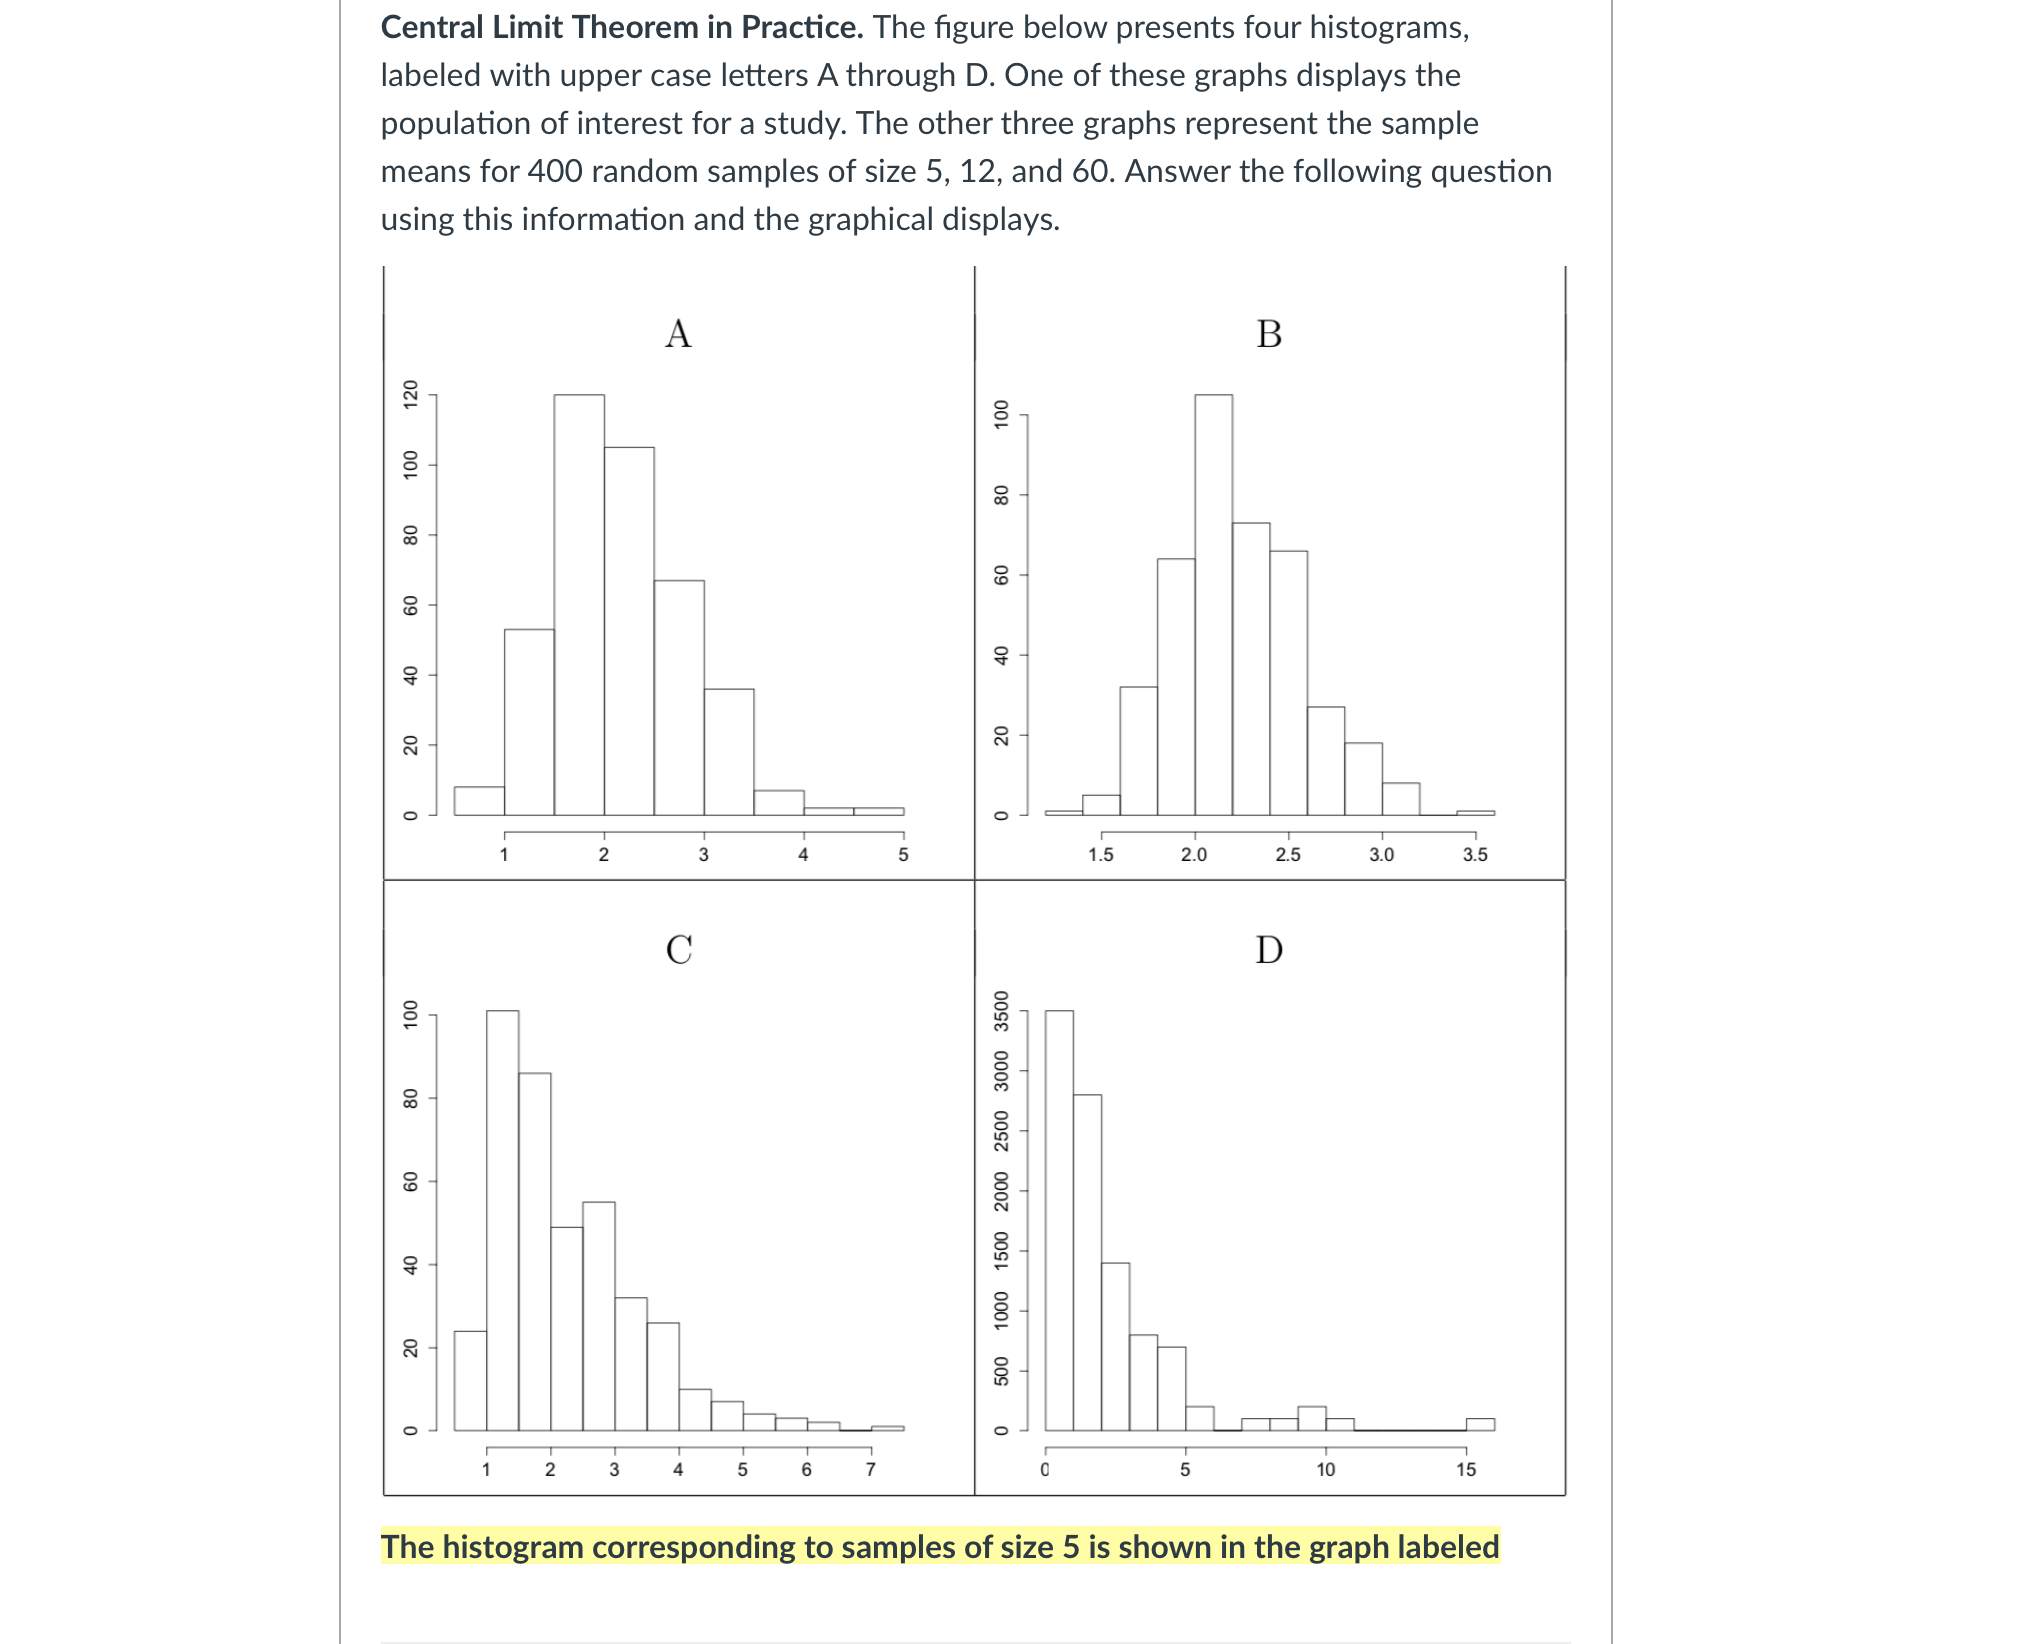
Central Limit Theorem in Practice. The figure below presents four histograms, labeled with upper case letters A through D. One of these graphs displays the population of interest for a study. The other three graphs represent the sample means for 400 random samples of size 5, 12, and 60. Answer the following question using this information and the graphical displays. A B 100 8 O O 2 3 4 5 1.5 2.0 2.5 3.0 3.5 C D 100 500 1000 1500 2000 2500 3000 3500 O 2 3 4 5 6 5 10 15 The histogram corresponding to samples of size 5 is shown in the graph labeled
Step by Step Solution
There are 3 Steps involved in it
1 Expert Approved Answer
Step: 1 Unlock

Question Has Been Solved by an Expert!
Get step-by-step solutions from verified subject matter experts
Step: 2 Unlock
Step: 3 Unlock